


 he relaxation times of pure substances, for instance water, can be easily explained. A living system, however, contains a large number of chemical components, all of which contribute to the observed proton magnetic resonance signal. These components possess different relaxation times. Thus, the analysis of the observed NMR signal in terms of the different subsystem parameters (relaxation times and concentration) is complex but very important.
For the sake of simplicity, we will deal with T1 only in two-component systems. A similar discussion is possible for T2.
For example, T1 of muscle tissue protons obtained at 0.1 Tesla is about 300-400 ms, but more than three quarters of the received proton signal stems from water protons, which in the pure liquid show a T1 of several seconds.
 Using an example from clinical routine, cerebrospinal fluid (CSF) has similar relaxation times as water. Brain edema, which reflects pathologically high water content in brain tissue, possesses relaxation times that are closer to brain tumors than to CSF (Figure 04-03).
What is the reason for this discrepancy?
This is best explained using the relaxation rate R1. R1 equals 1/T1. Several different R1 components can be added to each other to create a new R1 (cf. Chapter 12).
The T1 of a biological sample is a parameter reflecting the physical and chemical properties in the environment of the observed nuclei. If the environment is not the same throughout the sample, then the obtained T1 will only reflect the mean properties of the sample. In most tissues, one component, usually water, dominates the relaxation behavior. In special cases, where two components with significantly different T1 values are present in comparable amounts, a complex situation arises, which makes a quantitative interpretation difficult.
Let us consider two systems containing two different groups of protons, one moving fast, one moving slower. Both possess different T1 relaxation times and thus different R1 relaxation rates. We can compare them with the example in Figure 04-06.
Here we have two containers, I and II, filled with water. Both of them have an outlet, but the outlet of Container II is larger than that of Container I (Figure 04-06a). The rate, R, at which water is leaving I and II can be expressed in milliliters per second, and the time needed to empty the containers is given by V/R, where V is the volume of the water (assuming that the water pressure is constant).
If we construct another container (Container III) with volume V and equip it with two outlets (Figure 04-06b), one similar to the outlet of Container I and one similar to the outlet of Container II, then the water in this container will leave at a rate which is the sum of the two outlet rates.
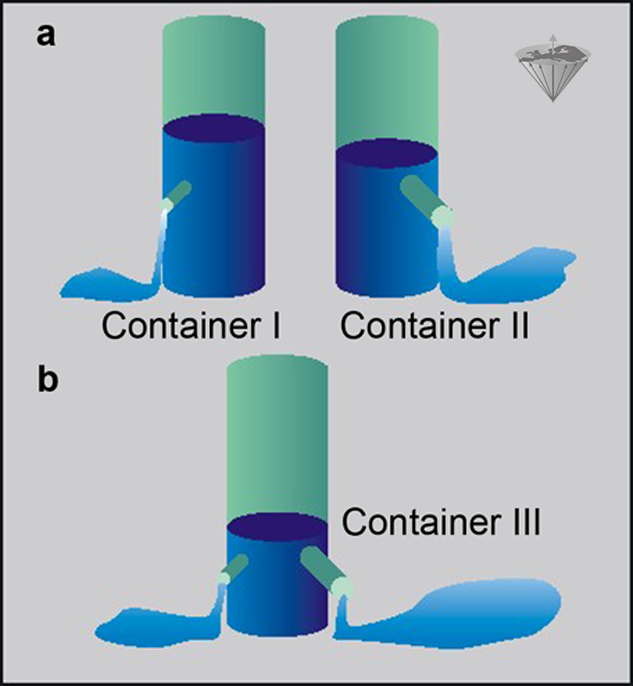
Figure 04-06:
The container example explains the use of relaxation rates instead of relaxation times in a complex system.
(a) Two containers I and II with differently sized outlets;
(b) one container with two differently sized outlets.
This reflects the relaxation time of a tissue composed like our example in Figure 04-03. Although we have two different components, we only measure one common relaxation time for this tissue.
If the exchange rate between the two groups of protons is very slow or absent, we can identify two different contributions to the relaxation behavior. A physical reason for such a behavior can be found, for example, in samples containing both fat and muscle tissues. The fat cannot exchange protons with the water in the muscle tissue. In the case of slow proton exchange, the system will show double exponential relaxation. Other biological systems can show a single exponential relaxation behavior, as if they were relaxing governed by a single relaxation time.
It is possible to distinguish the data, provided that enough data points are available. However, the accuracy actually needed for such measurements is often underestimated, in particular in whole-body imaging machines.
Solids, such as proteins and membranes, have a wide range of resonance frequencies, which allows for energy exchange between different parts of the solid. The process of energy exchange in a solid is referred to as spin diffusion. Thus, if part of the solid relaxes more rapidly than the rest, it can enhance the relaxation of the whole solid.
A similar process can occur between solids and bound water molecules, with the presence of solids (such as proteins and membranes) in tissue acting to reduce the observed relaxation time for water. This process is described as off-resonance irradiation and can be exploited to enhance contrast (magnetization transfer contrast; cf. Chapter 11).


|
Chapter 4 — Page 2 |

|
|---|