


 he following paragraphs present the fundamentals and the development of the techniques of three clinical examples. Lesion characterization often requires a dynamic contrast series.
However, procedures and indications continue to be a subject for debate.
Contrast-enhanced studies may show pathologies better than plain images or assist in diagnosis. Few will be truly decisive. But they facilitate treatment and mental comfort for patients and radiologists alike. The only clear and undisputed indication is breast MRI. Without a contrast agent, this examination is useless. With contrast enhancement, it is the best mammography technique we have.
As described by Harms [⇒ Harms 2001], the use of MRI in the role of breast cancer staging has the following minimum requirements:
 (1) It must have high-resolution (approximately 1 mm resolution in all three directions) in order to consistently detect cancers missed by mammography;
(2) it should employ fat suppression in order to separate enhancing tumors from fat; and
(3) it should be a rapid acquisition (preferably about 5 min) in order to separate enhancing tumors from ductal tissue that has been shown to have delayed enhancement. Dynamic imaging reveals that tumors and ductal tissue intensities merge and become isointense between 5 and 10 min post-injection.
Dynamic imaging of the breast became the first major application of dynamic MR imaging with gradient-echo pulse sequences being used. The combination of rapid imaging and contrast agent application increased both sensitivity and specificity of breast MR imaging (MRM = magnetic resonance mammography) and allowed the differentiation between benign and malignant lesions.
Signal intensity-versus-time uptake curves showed that malignant lesions take up contrast agent faster than benign lesions, although there remained a certain overlap. Since these measurements were done manually, it was difficult to find the pixel or region of highest uptake of contrast agent within the breast, in particular on gray-scale images. In these cases, postprocessing became very valuable.
Originally, subtraction images were used; however, this approach highlights all pixels with contrast enhancement without any differentiation between fast and slow enhancement over time.
Then, mathematical approaches to enhancement curves were introduced to create parametric images, calculating a parameter value for each pixel in a slice and plotting the values as an image, typically a gray-scale image with the intensities proportional to the parameter value. Pixel-by-pixel calculation of enhancement intensity and speed or slope led to parametric images which can be color-coded in a way that regions of fast and high enhancement are highlighted in a specific color.
For instance, enhancement of more than 90% in less then 90 seconds on T1- weighted images, or signal intensity loss of > 20% during the first 30 seconds after contrast material injection on T2*-weighted images, is considered typical for malignant breast lesions, although not all malignant lesions follow this pattern (Figure 16-08) [⇒ Boetes 1994, ⇒ Flickinger 1993, ⇒ Gribbestad 1994, ⇒ Heywang-Köbrunner 1995, ⇒ Kaiser 1990, ⇒ Kvistad 2000, ⇒ Torheim 1997].
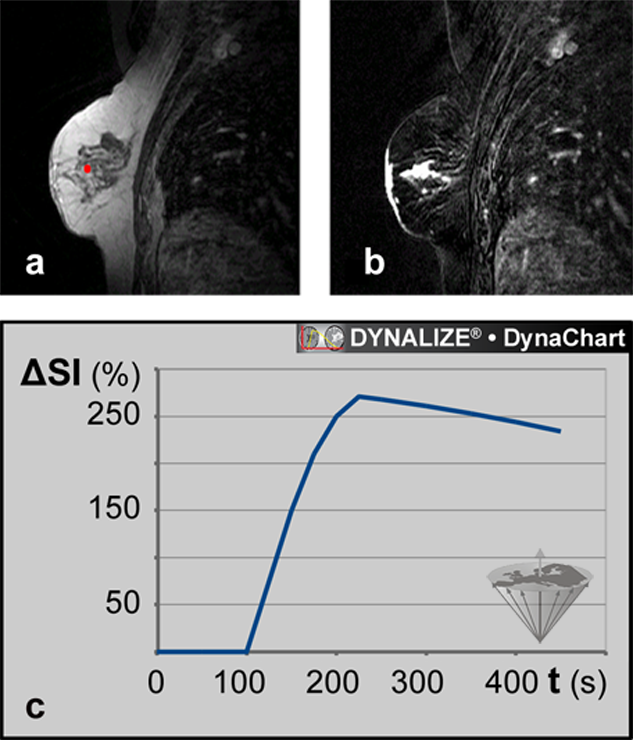
Figure 16-08:
Magnetic resonance mammography (MRM).
(a) Image from a data set of 44 dynamic slices. T1-weighted RF-spoiled gradient-echo sequence. The ROI is positioned in the tumor.
(b) Same patient: Parametric map based on the T1-weighted image time series: maximum enhancement image.
(c) Dynamic uptake curve of an ECF contrast agent in the breast lesion depicted in (a) and (b).
Processing of dynamic imaging with color coding can also visualize the enhancement pattern over time. When large enough, fibroadenomas usually demonstrate initial peak enhancement in the center of the tumor, whereas carcinomas tend to enhance in the periphery. However, since the enhancement pattern depends on the vascularity of the lesion, no direct histological tumor-typing by dynamic MRI is possible.
Figure 16-09 shows the dynamic uptake patterns of a number of breast lesions. The curves are created by the averaged intensities in regions-of-interest in frames. A frame is an image series along the time axis (time series).
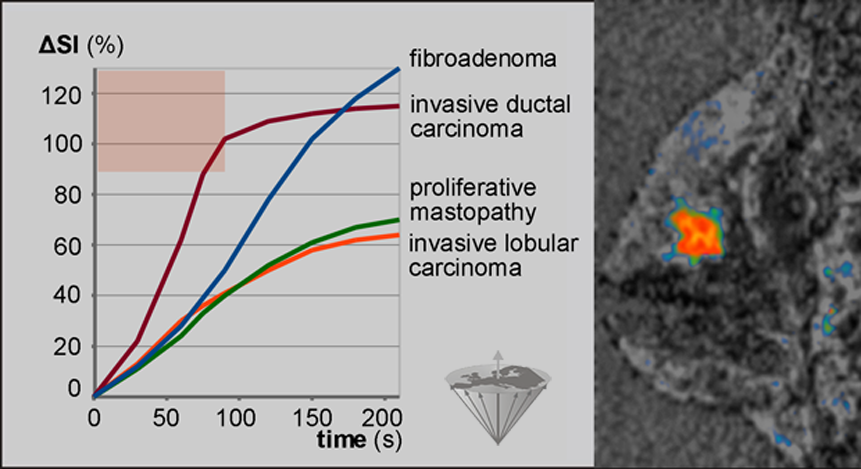
Figure 16-09:
Dynamic uptake pattern of a Gd-based ECF-space agent in breast lesions. Enhancement of more than 90% in less than 90s (reddish area) after bolus injection occurs most likely in invasive ductal carcinomas only. Thus, such tumors can be identified in parametric images, where all pixels with enhancement >90% at time ≤90 s can be color-coded. The carcinoma is this picture appears in bright red.
 Meanwhile, a shortened breast MRI protocol comprising an abridged dynamic series of one pre- and one post-contrast acquisition has been proposed. The resulting subtracted images are processed by maximum intensity projection (MIP).
There are a large number of partly contradictory publications on dynamic MR imaging of the breast. Besides the above mentioned detailed overview by Harms another excellent review was published by Kuhl [⇒ Kuhl 2015].
Dynamic (or perfusion) imaging of the brain must not be confused with functional imaging of the brain (fMRI) although similar pulse sequences and parallel imaging techniques are applied for these examinations [⇒ Petrella 2000, ⇒ Torheim 1997].
Echo planar techniques and gradient echo three-dimensional magnetic resonance imaging techniques, e.g., PRESTO (principles of echo shifting with a train of observations) [⇒ van Gelderen 2012] are applied for for bolus tracking. PRESTO allowes for higher temporal resolution and has less susceptibility artifacts. Regional cerebral blood volume (rCBV) can be estimated by fitting first-pass transit curves to the pixel intensities of a series of images.
Patients with acute stroke make up the group of most interest for dynamic imaging of the brain [⇒ Orrison 1995]. In clinical practice, perfusion imaging has proven to be an early and reliable predictor of prognosis in stroke patients. A number of researchers have found that the area of perfusion deficit seen in cerebral blood flow (CBF) and mean transit time (MTT) maps may extend beyond the area of hyperintensity seen in diffusion-weighted imaging and that the size of the infarct finally seen on delayed T2-weighted images matches the area of perfusion defect (Figure 16-10) [⇒ Østergaard 1998, ⇒ Rosen 1989, 1991].
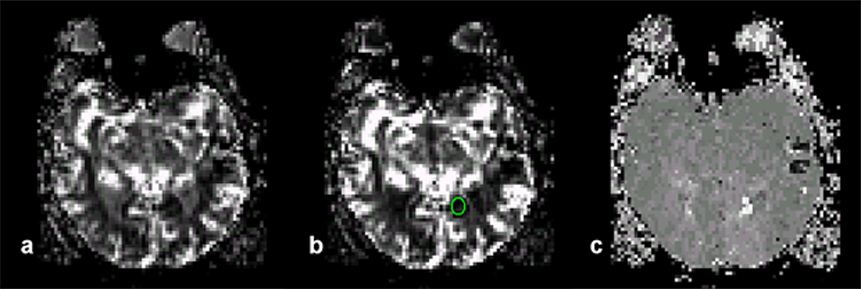
Figure 16-10:
Parametric images of the brain of a patient with recent stroke.
(a) Area under the curve image which is correlated to blood volume. The image was created by first converting the time-intensity curves into time-concentration curves by using mathematical processing. Non-perfused areas have a flat curve, thus the areas are small and thus the non-perfused regions show as dark.
(b) A ROI has been drawn to indicate an ischemic region.
(c) Time-to-peak image of the same slice. The perfusion in the ischemic region is delayed; it shows up in light gray.
Tracer kinetics principles first employed in nuclear medicine can be applied to generate cerebral blood volume maps [⇒ Belliveau 1990, ⇒ Tofts 1999].
Ultimately, the goal of perfusion imaging remains the visualization of the penumbra and thus the distinction between normal, salvageable, and irreversibly damaged tissue.
The main goal of myocardial perfusion imaging is the detection and delineation of hypoperfusion due to non-occlusive coronary artery stenosis. Screening for ischemic heart disease requires both high spatial and temporal resolution images with detection and quantification of abnormal wall motion, evaluation of cardiac metabolism, and measurement of regional myocardial perfusion [⇒ Atkinson 1990, ⇒ Lombardi 1995; 2018].
In the heart, the much higher blood volume and the abundance of susceptibility artifacts in plain imaging commend assessment of perfusion by T1-weighted dynamic imaging during the first pass of an appropriately low dose of a paramagnetic contrast agent.
Assessment of myocardial blood flow is difficult because a large fraction of extracellular contrast agents will extravasate into myocardial tissue during the first pass, making myocardial signal intensity dependent on both extraction fraction and flow. However, some research groups have succeeded in obtaining excellent delineation of hypoperfused areas using first-pass dynamic imaging with ECF-space contrast agents under stress, usually pharmacological stress [⇒ Higgins 1996]. Based upon defined ROIs, parametric images of the heart can be obtained by combining anatomical and functional information (Figure 16-11).
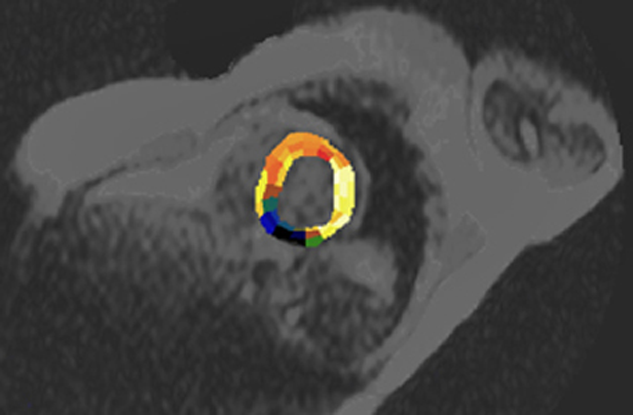
Figure 16-11:
In this case, the heart is semi-automatically divided into ROIs which follow the supply area of the coronary arteries. The parametric image represents the cross-correlation coefficient (CCC) calculated one week after coronary infarction (dark area). See also Chapter 14.
Other Applications. There are numerous other applications of dynamic imaging, including imaging of the liver, the kidneys, muscles and joints, the urinary bladder, and the prostate.
Critical Remarks. Image processing is useless if applied randomly without a well defined aim. Many approaches to explain results of dynamic imaging and image processing are based on hypotheses which are still to be proved, and much research in this field is empirical and heuristic.


|

|
|---|