


 ith numerous tissue parameters, MR imaging has substantial — theoretical — potential for tissue discrimination in different organs. The most important intrinsic contrast factors are proton density, T1 and T2 relaxation, and bulk flow.
The use of relaxation times for medical applications was first proposed in 1955 [⇒ Odeblad 1955].
Voxel-by-voxel in vivo relaxation-time measurements, partly turned into T1- and T2-maps, have been tried out over the years by a large number of researchers [⇒ Skalej 1985].
However, parametric T1 and T2 images did not enter into clinical routine. They were restricted to a single parameter only and revealed less information than images representing several parameters combined with different parameter-weighting.
This was one of the first major lessons to be learnt in MR image-processing: if one has more than one known factor influencing the contrast of an image, and if the change in contrast is perceivable by the human eye, it is not worthwhile to extract such a factor to create a parametric image. This holds in particular if this factor cannot be quantified exactly. In the case of relaxation times, only an estimation is possible in vivo.
In 1985, it was finally realized that even carefully performed in vivo T1 or T2 measurements cannot be used as a diagnostic method in cancer detection, characterization, or typing [⇒ Rinck 1985].
Quantification does not allow reliable tissue identification and classification.
For specific applications, pure relaxation time maps can be used to create synthetic MR images and to simulate image contrast behavior. Such techniques were proposed very early in MR imaging in the first half of the 1980s to allow fast retrospective optimization of image contrast.
A number of publications dealt with this [⇒ Bielke 1984, ⇒ Bobman 1985, ⇒ Riederer 1984, ⇒ Torheim 1994] and dedicated software programs, e.g., MR Image Expert [⇒ Torheim 1996] were developed for educational and research purposes. Several examples of simulated or synthetic MR images are shown in Chapter 10.
The procedure leading to synthetic images requires several steps. High-quality, low-noise simulations are based on true T1, T2, and proton density maps of the same slice or volume. Then pixel-by-pixel signal intensities can be calculated with standard equations: the operator-selected variables are, for instance, TR, TE, TI, and FA.
Such simulated images have substantially less noise than images acquired directly on an MR machine. Applying computer simulation for sequence optimization is time and cost efficient compared to in vivo experiments. They can be used when looking for specific anatomical or pathological features or to evaluate best pulse-sequence parameters for contrast agent enhancement or comparison of contrast at different field strength.
 MR Image Expert®, the simulator used for this textbook (Figures 15-09 a and b), could also be employed, e.g., for clinical imaging if integrated into a suitable MR equipment. The drawbacks of such image-processing programs are their dependence on specific 'clean' data acquisition sequences such as spin-echo or inversion-recovery pulse sequences with known contributing components where signal intensities can be exactly and reproducibly calculated.
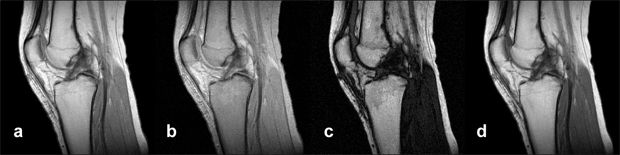
Figure 15-09a:
Simulation of an MR examination of a normal knee at 1.5 T. Series of synthetic inversion-recovery images; parameters TR|TE|TI: (a) 1000|10|20; (b) 1000|10|100; (c) 1000|10|260; (d) 1000|10|500.
Simulation software: MR Image Expert®
Figure 15-09b:
This example shows the contrast behavior of a meningioma using different repetition times TR and echo times TE (1.5 Tesla; plain study; no contrast agent application).
Simulation software: MR Image Expert®
In addition to the factors mentioned above (exclusion of many parameters influencing image contents and contrast, e.g., multiexponential decays, diffusion, and flow), multispectral processing and feature extraction for the creation of synthetic images are cumbersome and prone to substantial mistakes.
More so, in the brain, for instance, absolute signal amplitudes are proportional to the water content, not to 'proton density' because myelin lipids do not contribute to the signal [⇒ Fischer 1990], another of the many features that cannot be simulated.
The sometimes proposed MR fingerprinting based on multi-parametric data collection is unreliable and impracticable in diagnostic routine. Reasons and details have been discussed in Chapter 4: Practical Measurements of T1 and T2 and Measurements in Medical Diagnosis.
Synthetic images cannot be used to quantify data (e.g., relaxation constants or proton density in tissues).
T1 maps are used in research as the basis for estimating tissue concentrations of contrast agents in dynamic imaging. Here, two measurements are necessary, one before injection of the contrast agent, a second one after injection together with drawing a blood sample to determine the blood concentration of the contrast agent. It is rarely used in clinical routine.
When you reinvent the wheel …
 … always consider the flat tire problem


|

|
|---|