


 fter a spin system has been excited by an RF pulse, it initially behaves like a coherent system; i.e., all microscopic components of the macroscopic magnetization precess in phase (all together) around the direction of the external field. However, as time passes, the observed signal starts to decrease as the spins begin to dephase (Figure 04-14).
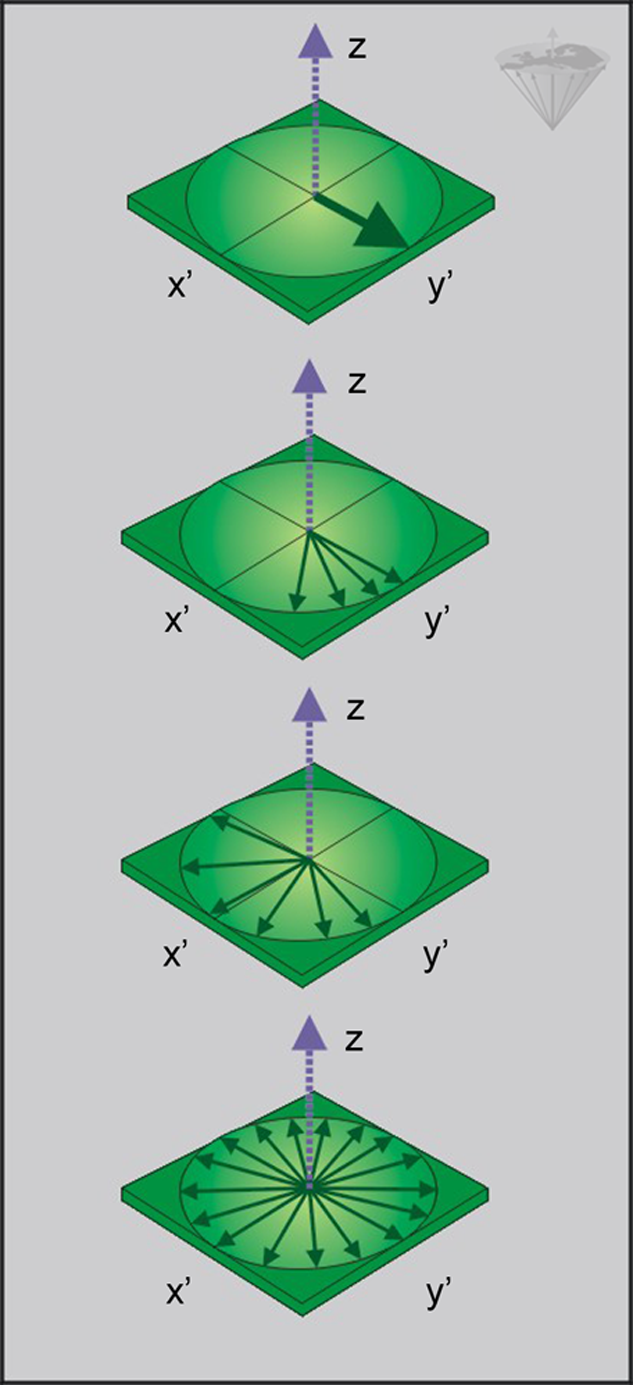
Figure 04-14:
Transverse relaxation phenomena induce an increase in dephasing of individual spins, so a progressive decrease of the macroscopic magnetization is observed.
The decay of the signal in the x'-y' plane is faster than the decay of the magnetization along the z-axis. This additional decay of the net magnetization in the x'-y' plane is due to a loss of phase coherence of the microscopic components, which partly results from the slightly different Larmor frequencies induced by small differences in the static magnetic fields at different locations of the samples.
This process is characterized by T2, the spin-spin or transverse relaxation. T2 is dependent on a number of parameters:
 resonance frequency (field strength), although for T2 this is less crucial than for T1 at low, medium, and high (but seemingly not ultrahigh) fields;
temperature;
mobility of the observed spin (microviscosity);
presence of large molecules, paramagnetic ions and molecules, or other outside interference.
In mobile fluids, T2 is nearly equal to T1, whereas in solids or in slowly tumbling systems (i.e., high-viscocity systems), static-field components induced by neighboring nuclei are operative and T2 becomes significantly shorter than T1.
In solids T2 is usually so short that the signal has died out within the first millisecond, whereas in fluids the magnetic resonance signal may last for several seconds. To a large extent, this is the cause of the low or absent signal from solid structures such as compact bone or tendons in medical magnetic resonance imaging.
With increasing field strength, T2 first increases as does T1. Then, while T1 still increases, T2 stays constant (on a plateau) but it might also appear to decrease. This could be due to microscopic susceptibility differences which can induce a T2* effect.
So, if we represent T1 and T2 versus the microscopic mobility of the spin system, we will obtain for T1 a curve passing through a minimum, corresponding to the Larmor frequency, and a continuously decreasing curve for T2 (Figure 04-15).
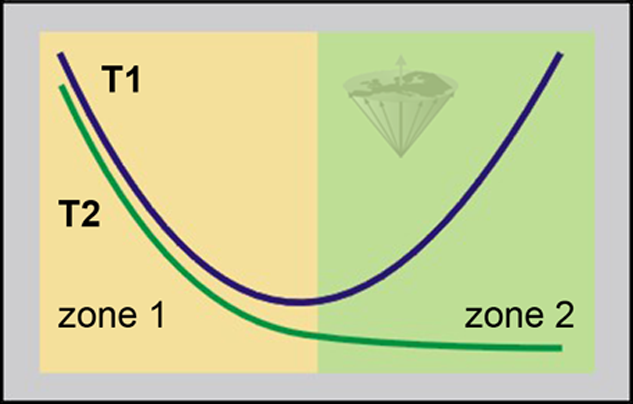
Figure 04-15:
Zone 1: high mobility with fast molecular motion; usually small molecules and ‘free’ water.
Zone 2: low mobility with slow molecular motion; usually large molecules and ‘bound’ water.
At low and medium fields, the T2 value is approximately 3 seconds and the T1/T2 ratio is 1 for pure water. The T1 value of tissues is usually under 1 second. Here, the T1/T2 ratio increases rapidly with values of 5-10 covering most tissue types. It is about 5 for muscle tissue at 0.1 T.
In practice, it is observed that the same sample can show two different T2 relaxation times at the same field strength. This is because two phenomena contribute to the local inhomogeneity experienced by the nuclei:
static and oscillating fields locally induced by neighboring magnetic moments (from other nuclei or unpaired electrons), and
imperfections of the main static magnetic field B₀ (field inhomogeneities).
This leads to a decay of the observed signal which is faster than T2. It is called T2* (T-two-star) (Figure 04-16). T2 has an irrecoverable decay whereas T2* has a recoverable decay and is always shorter than T2.
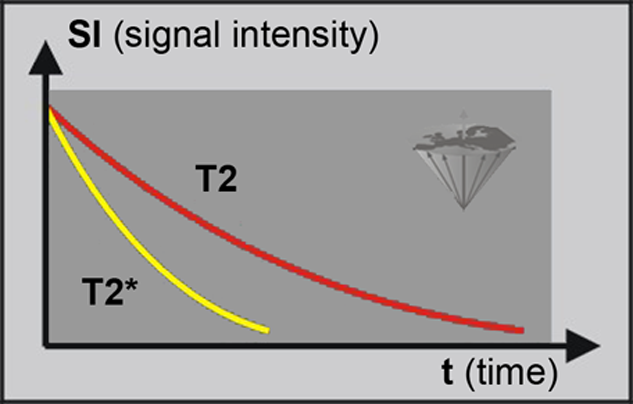
Figure 04-16:
T2 and T2*. The signal decay of T2* is faster than that of T2, because of field inhomogeneities and chemical shifts. However, the T2* can be made to reappear by applying a second RF pulse.
It is important to understand that T2* is not a constant or pure relaxation process, it is a capricious global parameter. It should not be used for quantitative diagnostic purposes because it is a fluctuant time (or time range) for loss of phase coherence among spins oriented at an angle to the static magnetic field and depends on the location of the molecule in the magnet. These inhomogeneities can easily change, in MR imaging for instance if the patient moves or turns.
Let's use a comparison: each of one thousand tuning forks of the same type (frequency) vibrating while dephasing have their sound decaying slower than the global sound perceived. The main parameters contributing to T2* are spin-spin interactions, magnetic field inhomogeneities, magnetic susceptibility, and chemical shift effects.
 For a given experiment (a single examination) T2* can be calculated in a similar way as T1 of complex systems (see the container example, Figure 04-06) by adding the R2 relaxation rates.
The observed decay rate R2* (R2* = 1/T2*) thus is related to the true spin-spin relaxation rate R2 (R2 = 1/T2) and to that induced by the field inhomogeneities R2inh or R2’ (R2inh = 1/T2inh):
where γ is the gyromagnetic ratio (unit: MHz/T), ΔB₀ the difference in strength of the locally varying field (unit: T).
In case the signal is influenced by flow or perfusion, this has to be taken into account additionally, leading to an apparent T2 value: T2app.
To remove the effect of field inhomogeneities, a spin echo (SE) can be used; its amplitude depends on the time, TE, which has elapsed since the initial excitation. This is done in one of the formerly most common imaging sequences, the spin-echo pulse sequence, which was the standard pulse sequence in magnetic resonance imaging and the mainstay of clinical diagnosis. Even after the introduction of specialized pulse sequences for distinct diagnostic questions, SE remains the pulse sequence of preferred use if any doubt exists.


|
Chapter 4 — Page 4 |

|
|---|