


 xcitation of an equilibrium system always transfers the system to an unstable state of high energy. The length of time the system will remain there depends on the local conditions (Figure 04-01).

Figure 04-01:
Spinning away into dreams: you may need relaxing times to understand relaxation times. But how long will you stay in this position of low energy when the waves start hitting you?
For a system of spin nuclei in a magnetic field, an unstable situation is created by a wave: the excitation pulse — the system is ‘pumped up’ with energy supplied by the RF pulse. At the molecular level, the return to equilibrium depends on the local magnetic and electric conditions at the excited nuclei.
If an isolated proton is left excited in absolute vacuum in the absence of any sort of electromagnetic fields, several years might be needed before the nucleus could, by itself, spontaneously return to the equilibrium state of low energy. However, if the proton is surrounded by water, this process can be ‘stimulated’ by the surrounding nuclei and will then require only a few seconds.
We need a resonance to exchange energy from the external world to the spin system. The excited spin system needs to be exposed to electromagnetic fields oscillating with a frequency at or close to the Larmor frequency of the nuclei before it can relax. The relaxation corresponds to the excess nuclei which were transferred to the upper energy level returning to the lower energy level (Figure 02-06 and Figure 04-02). Table 04-01 gives an overview of the different phenomena the system is or can be exposed to while returning to its equilibrium.
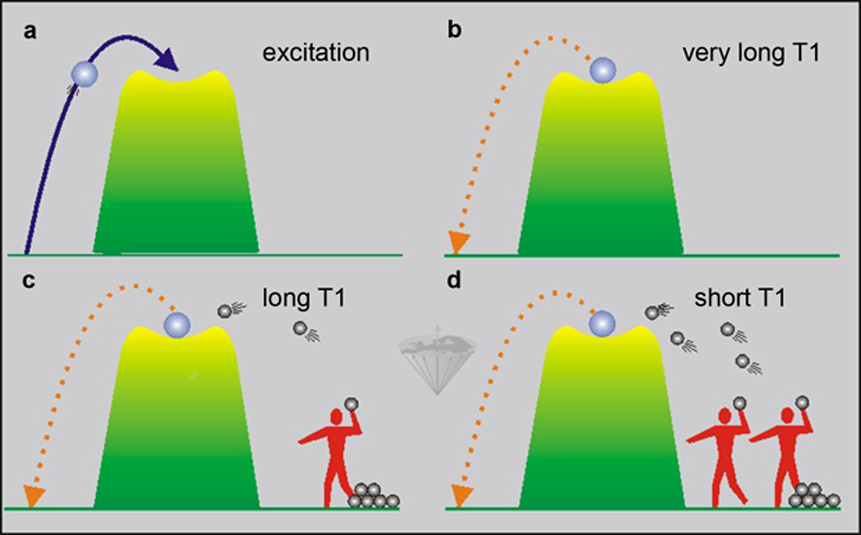
Figure 04-02:
(a) and (b): A ball is stuck on top of a small hill (unstable high state of energy).
(c) and (d): If two boys try to get it down by throwing rocks at it, on statistical grounds, it will take less time for two boys to achieve their goal compared with one boy.
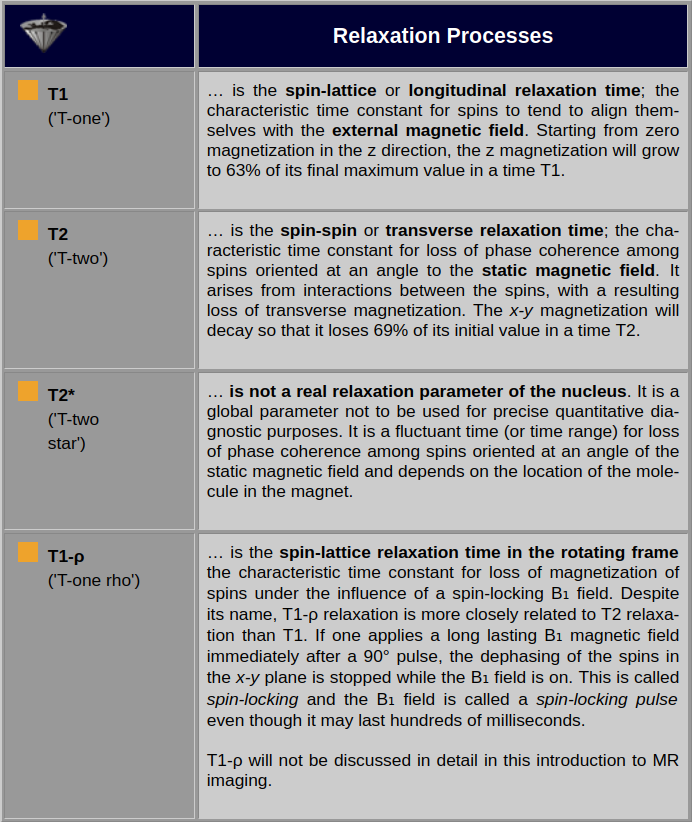
Table 04-01:
The different relaxation processes. T1 and T2 are the important relaxation times for MR imaging.
The first process of returning to the equilibrium from an excited state is called the spin-lattice relaxation process or longitudinal relaxation process. It is characterized by the T1 relaxation time. The T1 relaxation time is the time required for the system to recover to 63% of its equilibrium value after it has been exposed to a 90° pulse.
For a given kind of nucleus, T1 depends on several parameters:
 type of nucleus;
resonance frequency (field strength);
temperature;
mobility of observed spins (microviscosity);
presence of large molecules;
presence of paramagnetic ions or molecules.
The presence of large molecules or of paramagnetic ions or molecules is of special interest. In pure water, the process of reorientation (translational movement, rotation, etc.) of a single water molecule occurs very rapidly. Since each molecule has its own magnetic field, this rapid reorientation results in a fluctuating magnetic field at neighboring nuclei.
To promote relaxation, the frequency of the reorientation must be at, or close to, the resonance frequency in pure water. If the frequency of this reorientation is much higher than the Larmor frequency of the protons the relaxation is inefficient.
However, if we add more slowly moving large molecules such as proteins to the water, the water molecules will interact with them. The interaction involves temporary attachment of the water to the proteins and subsequent release. This temporary bonding radically reduces the frequency with which the water molecules reorientate themselves. Pure water, i.e., water in the bulk phase, moves much faster than water close to macromolecules or membranes.
The slower the molecular motion, the shorter the relaxation times T1 (and T2), shown in Figure 04-03 as an increase in brightness.
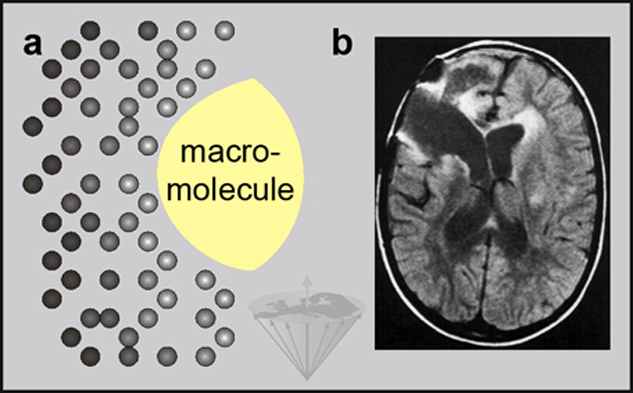
Figure 04-03:
(a) The slower the molecular motion, the shorter the relaxation time T1 (increase in brightness).
(b) T1-influenced image after a brain tumor operation. Fluid-filled areas are dark, edematous areas are bright: bulk water moves faster, protein-bound water in brain edema slower (shorter T1).
To characterize the motion of a molecule, the correlation time (tc) is used. It measures the minimum time required for a molecule to re-orientate itself.
Because of the presence of protein surfaces, the T1 relaxation times of water in living tissue are always shorter than those obtained for pure water. Table 04-02 lists some representative T1 values of normal tissues. T1 values vary with magnetic field strength. This influences image contrast in MR imaging so that it is not possible to make direct quantitative comparisons between T1 values at different fields. Thus, it is necessary to always mention the field strength when quoting T1 values.
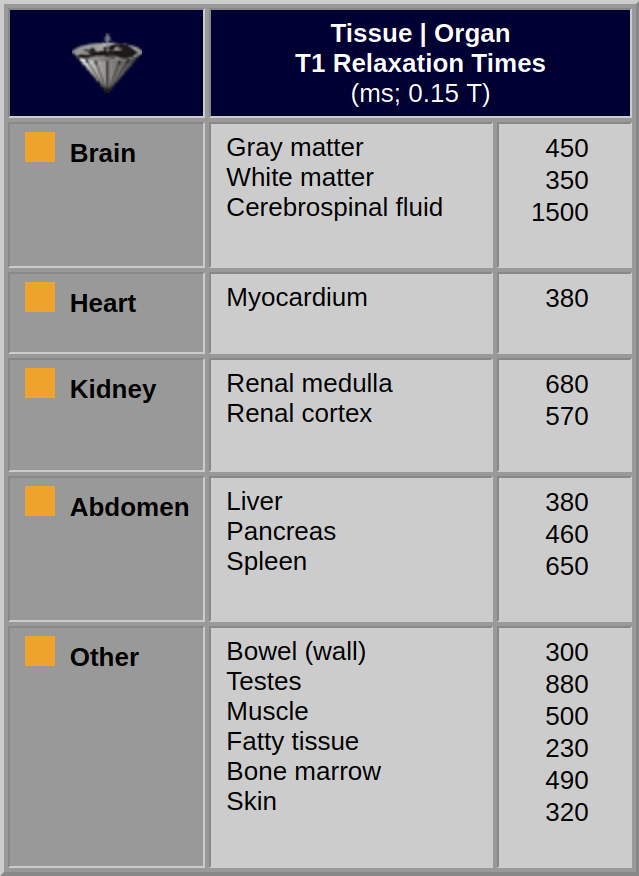
Table 04-02:
T1 values of some human tissues measured on an MR imaging system at 0.15 Tesla. The standard deviation of these values can be between 10 and 30%; in general, relaxation time values measured in vivo are not very reliable.
T1 data of brain tissues at different fields are shown in Figure 04-04 (more details can be found in Chapter 10).
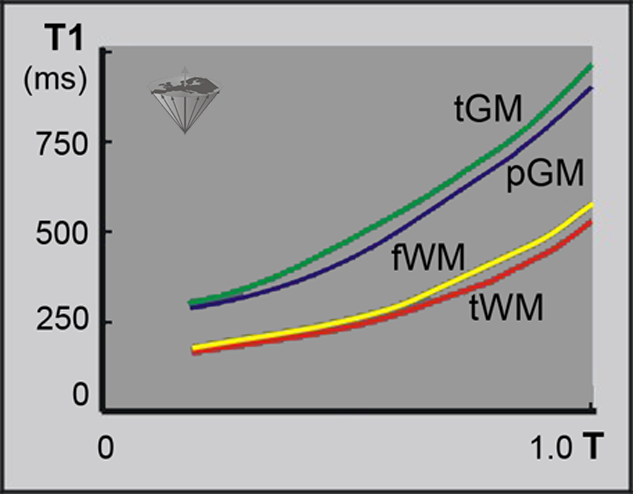
Figure 04-04:
Change of T1 relaxation times of gray and white matter versus field strength. Temporal gray matter (tGM) is depicted green and parietal GM (pGM) is blue; frontal white matter (fWM) is depicted yellow, temporal WM (tWM) is red. T = field in log Tesla.
 The data for this figure was acquired with a special NMR equipment dedicated to relaxometry. This subdiscipline of NMR deals with the relaxation behavior of different substances. With a field-cycling relaxometer, ex vivo or in vitro measurements of the relaxation behavior of tissue samples or contrast-enhancing compounds can be performed at high accuracy at any field strength; thus identical samples can be examined under identical conditions.
Field-cycling relaxometry showed that T1 increases nonuniformly with field, leading to specific ‘fingerprints’ of T1 increase for different tissues [⇒ Rinck 1988]. However, due to the complexity of the method, such fingerprints or biological markers have only limited scientific and no clinical diagnostic relevance.
Fast Field-Cycling (FFC) can also be used as an imaging technique that exploits varying magnetic fields to quantify molecular motion, providing noninvasively structural information. However, its clinical potential seems to be rather limited [⇒ Mallikourti 2024].
The explanation as to how the presence of paramagnetic ions or molecules can enhance the relaxation rate of water is highly complex. Electrons produce a much stronger magnetic field than nuclei, but when pairing of electrons occurs, there is only a weak net field.
Paramagnetic compounds influence excited spins in a similar way and shorten T1. They have unpaired electrons; their reorientation produces a very strong fluctuating magnetic field, resulting in a significant reduction in the relaxation time (Figure 04-05).
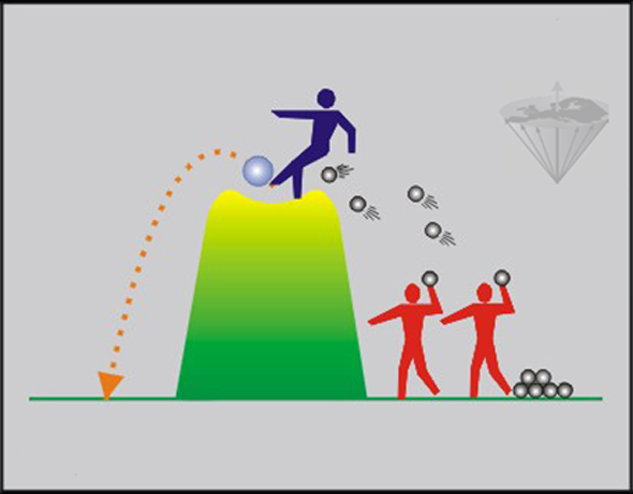
Figure 04-05:
The boys of Figure 04-02 have invited another boy (called 'Gadolinium'). His presence on top of the hill kicking the ball down significantly shortens the time the ball would stay in the unstable state.
Typical paramagnetic substances include Mn²+, Cu²+, Fe²+, Fe³+, Gd³+, as well as molecular oxygen and free radicals. In certain circumstances, the ability of paramagnetic compounds to alter relaxation rates can be utilized to change the contrast in magnetic resonance images; for this purpose, for instance gadolinium and manganese complexes are used as magnetic resonance contrast agents (see Chapter 13).


|
Chapter 4 — Page 1 |

|
|---|