


 lthough it is very easy to see fat and water in a spectrum of tissues, it is not very interesting from a medical point of view, and in fact the signals of the fat and water are so large that it can be very difficult to see the interesting metabolites. Therefore, most early MRS studies tended to concentrate on other nuclei, and the most popular was ³¹P.
At a given magnetic field, the resonance frequency of ³¹P will be approximately 0.405 that of ¹H, so that at 2.35 Tesla ¹H has a resonance frequency of 100 MHz and ³¹P has a resonance frequency of 40.5 MHz. A ³¹P transmitter or receiver coil will have to be tuned to a very different frequency range than a ¹H transmitter or receiver coil, so that there is no possibility of detecting the wrong nucleus.
³¹P has a wide chemical shift range due to the wide range of chemical bonds which can be formed to phosphorus. However, the chemicals which are of interest in biological studies fall within a much smaller range of chemical shift (about 25 ppm).
The metabolites which can typically be seen in in vivo spectra are phosphocreatine (PCr, important in energy metabolism), inorganic phosphate (Pi), phosphomonoesters (PME, including sugar phosphates like glucose-6-phosphate), phosphodiesters (PDE, which can include lipid precursors like phosphoryl-choline and phosphoryl-ethanolamine, and lipids themselves) and adenosine-triphosphate (ATP, which has a central role in energy metabolism).
Apart from ATP, all of these metabolites just have one phosphorus atom per molecule so that there is only one resonance or peak per molecule. This makes the spectra relatively simple to interpret, but it can also be a drawback if the cells have a number of chemically similar phosphorus-containing molecules. Thus, it is very difficult to distinguish between glucose-6-phosphate, fructose-6-phosphate, and other hexose-6-phosphates since all peaks tend to overlap. This is a general problem in spectroscopy; the ability to distinguish between peaks is called resolution, and if two signals have a big enough difference in chemical shift so that they can be seen as two peaks, then they are said to be resolved (Figure 05-03).
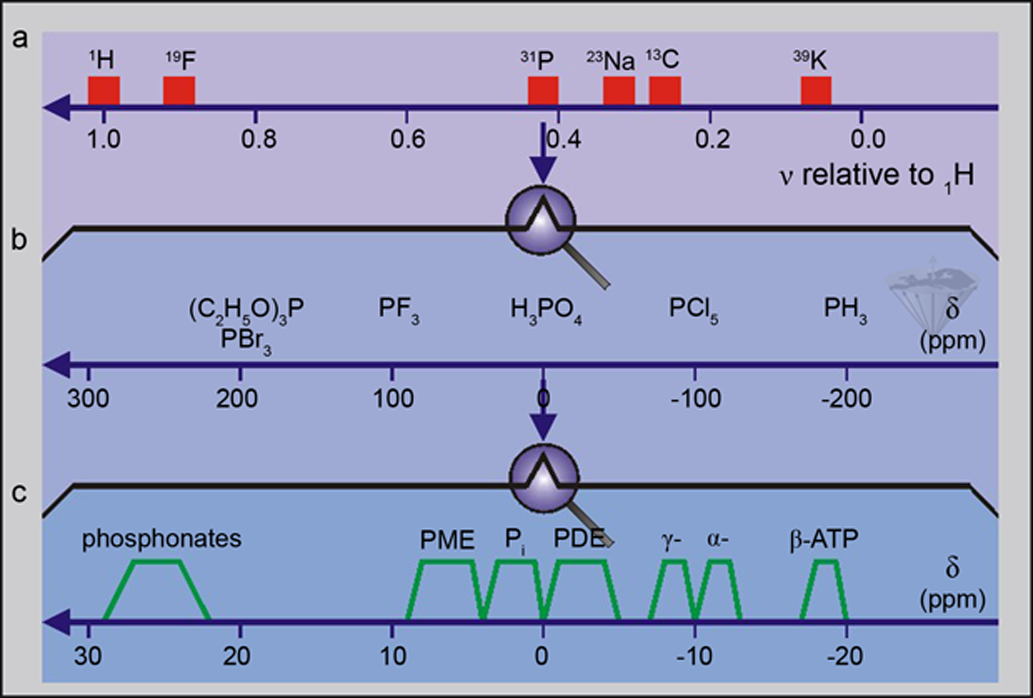
Figure 05-03:
(a) An overview of the resonance frequencies of a number of nuclei relative to ¹H.
(b) An expansion of the frequency region where phosphorus nuclei give rise to signals.
(c) A further expansion of the frequency region showing where phosphorus-containing molecules of biological interest give rise to signals.
ATP is different from the other molecules mentioned so far because it has three phosphorus atoms in each molecule. The α-phosphate has an adenosine group on one side and a phosphate group on the other; the β-phosphate has a phosphate group on each side; and the γ-phosphate has a phosphate group on one side of it. Thus, the three phosphorus atoms are chemically distinct and we see three peaks in the ³¹P spectrum of ATP.
Figure 05-04 shows the ³¹P spectra of a human leg muscle and a human brain. The two spectra look very different, although most of the signals are present in both spectra. One difference is that the peak line widths are relatively narrow in the leg spectrum, whereas they are relatively broad in the head spectrum. This is due to the different physical environments experienced by the molecules in brain and muscle tissue.
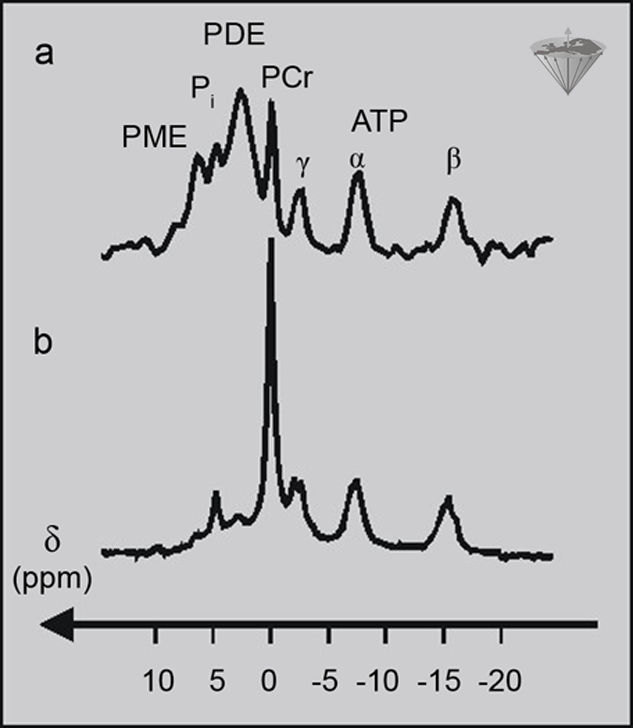
Figure 05-04:
(a) ³¹P spectrum of a human brain;
(b) ³¹P spectrum of a human leg muscle.
The different concentrations of ³¹P metabolites in the two tissues affect the relative peak area, and the different physical environments of the metabolites in the tissues affect the widths of the peaks.
However, the concentration of a metabolite detected in an NMR experiment is proportional to the area under a peak, not just the peak height, so a tall, narrow peak may not necessarily represent a higher concentration than a short, broad peak. Another difference between the spectra in this figure is the relative signal strengths of the phosphorus metabolites. The muscle spectrum is dominated by the PCr peak and the ATP peaks, whereas the brain spectrum is dominated by the very broad PDE peak, with quite strong signals from PCr and ATP as well.
 A good selection of articles about ³¹P spectroscopy can be found in Matson's and Weiner's review [⇒ Matson 1999], and information about applications can be found in Rubaek Danielsen’s and Ross’ book [⇒ Rubaek 1999].
The spectra in Figure 05-04 reflect ‘snapshots’ of the metabolic state of a tissue, but magnetic resonance spectroscopy can also be used to follow changes in metabolism over a period as short as a few minutes or as long as several weeks or even months. Figure 05-05 contains a series of ³¹P spectra of a human calf muscle taken every 90 seconds [⇒ Timm 1996].
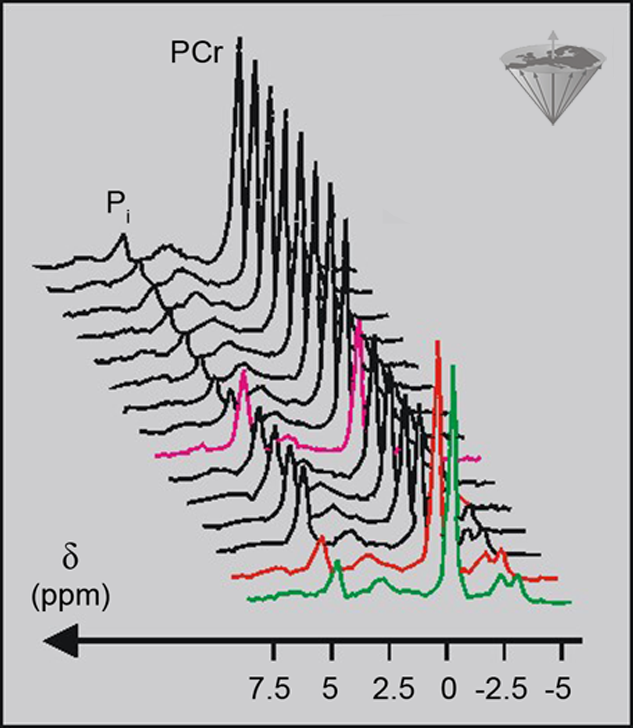
Figure 05-05:
A time-series of ³¹P spectra of a human calf muscle showing how exercise and recovery affect the phosphorus metabolites. Each 90 seconds a new spectrum was acquired.
Green = rest; red = beginning of exercise; magenta = beginning of recovery.
During the first three minutes, the muscle was at rest, then the muscle was exercised for 7.5 minutes during which the data acquisition was continued. Finally, spectra were collected for a further twelve minutes as the muscle was recovering. The spectra were plotted to emphasize changes in PCr and Pi. They demonstrate very nicely how PCr is used in the muscle during exercise to maintain the ATP at a constant level; the PCr peak declined, but there was no change in the ATP peaks. The increased Pi level following the hydrolysis of PCr to Cr and Pi during exercise can also be seen in the spectra. With such good time resolution, it is possible to measure the rate of change of the metabolites as well as the size of the changes.
Spectroscopy can also be used to follow changes over periods of days or weeks, e.g., monitoring the response of a tumor to therapy [⇒ Southon 1993].
The advantages of ³¹P MRS are that phosphorus containing metabolites play an important role in energy metabolism, and they occur in reasonably high concentrations, particularly in muscle tissue, but also in brain and liver, for example.
One disadvantage of ³¹P MRS is that it gives a relatively poor discrimination of metabolites in vivo. There might be in the order of 10 different metabolites contributing to the PME peak of an in vivo spectrum but the peaks all overlap each other so that the individual metabolites cannot be distinguished.
Another problem with ³¹P is that outside the major energy metabolites the signals are either too broad to detect, for example phospholipids, or too weak to detect, for example the phosphorylated intermediates of glycolysis, or there are no phosphorus containing metabolites to detect, for example Krebs' cycle intermediates, amino acids, lipids, or sugars.
This means that other nuclei need to be used to study these non-phosphorus containing metabolites.


|
Chapter 5 — Page 2 |

|
|---|