


 hemical-shift imaging (CSI) uses gradients on each of the three axes to encode the spatial position on to the signal using a technique known as phase encoding.
The signal is then observed in the absence of any gradient [⇒ Brady 1986, ⇒ Hugg 1992]. Phase encoding is dealt with in more detail in Chapter 6.
In CSI, the whole volume is divided into a number of voxels. If we divide the volume into 512 voxels (8×8×8), then each phase-encoding gradient is stepped through eight values. Since they must be independently stepped, we require a total of 512 steps. A three-dimensional Fourier transformation then yields the spectrum for each of the voxels.
The main drawbacks of this technique are that it generates very large amounts of data and is rather susceptible to motion artifacts. To reduce these problems, CSI can be combined with other localization techniques so that the phase encoding is applied to only one or two dimensions.
The main advantage of CSI is that it is a Fourier technique, and so the signal at each acquisition contributes to the signal in all of the voxels, making it very efficient in terms of signal-to-noise ratio and acquisition times.
CSI was considered a promising technique because it allows the depiction of metabolite concentrations in cross-sectional images similar to those depicting anatomy, but with much lower spatial resolution. Usually in magnetic resonance spectroscopic imaging, the size of a volume element is at least 1000 times larger than in MR imaging (Figure 05-08).
However, compared to plain spectroscopy, the efficiency of MRSI is much increased because data of many volume elements are obtained at the same time and the regions of interest do not have to be identified before the examination.
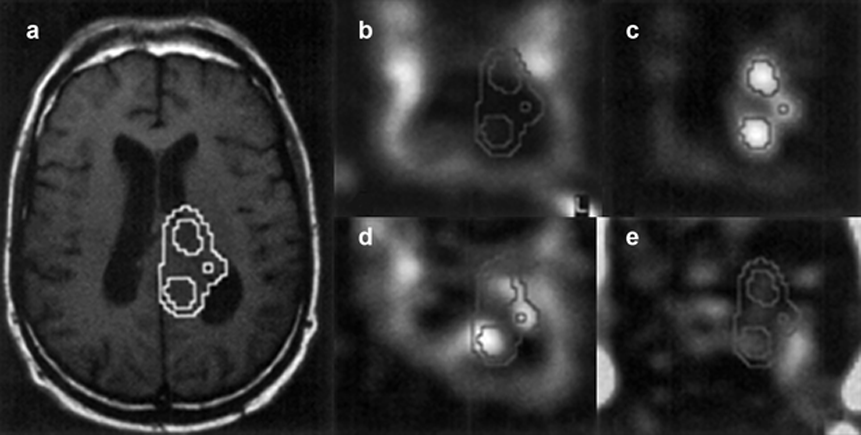
Figure 05-08:
Proton magnetic resonance spectroscopic imaging (MRSI) of a patient suffering from a high-grade glioma.
(a) Conventional T1-weighted spin echo MR image with overlayed choline contour.
Metabolite maps of (b) N-acetylaspartate, (c) choline, (d) creatine, and (e) lactate.
N-acetylaspartate is decreased in the tumor and the ventricles, whereas the choline level is elevated in the tumor. Regions with increased choline levels do not overlap regions showing lactate, which is an indication of the location of the active parts of the tumor.


|
Chapter 5 — Page 5 |

|
|---|