


![]() n spin-echo images, fast-flowing blood appears dark, slowly moving blood appears relatively bright. Slow-flowing cerebrospinal fluid appears dark on T1-weighted images and bright on T2-weighted images because (at 1.5 T) the T1 relaxation time of blood is approximately 1200 ms, while that of CSF is 3000 ms; the T2 relaxation times are 150 ms and 500-3000 ms, respectively.
n spin-echo images, fast-flowing blood appears dark, slowly moving blood appears relatively bright. Slow-flowing cerebrospinal fluid appears dark on T1-weighted images and bright on T2-weighted images because (at 1.5 T) the T1 relaxation time of blood is approximately 1200 ms, while that of CSF is 3000 ms; the T2 relaxation times are 150 ms and 500-3000 ms, respectively.
Relatively fast-moving CSF, however, behaves like blood. Figure 14-03 shows an example of fast-flowing CSF and its influence upon contrast in a T2-weighted image. Fast-flowing blood appears dark in intermediately, T1- and T2-weighted spin-echo images (Figure 14-04).
This can be very helpful for the differential diagnosis of aneurysms, angiomas, vascular malformations or similar diseases (Figure 14-05). Bright signal intensity where flow voids are to be expected, supports the diagnosis of slow flow or thrombosis.
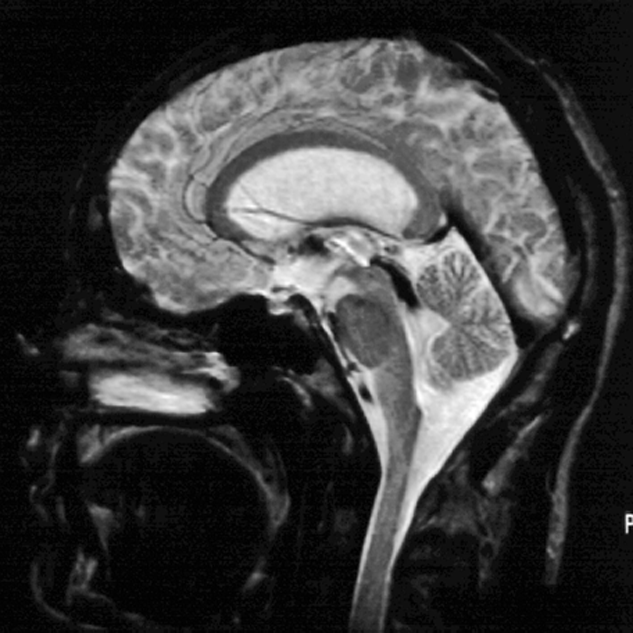
Figure 14-03:
Patient with hydrocephalus. On this T2-weighted SE image, CSF should be bright. However, due to flow effects, CSF in the aqueduct and the upper fourth ventricle appears dark.
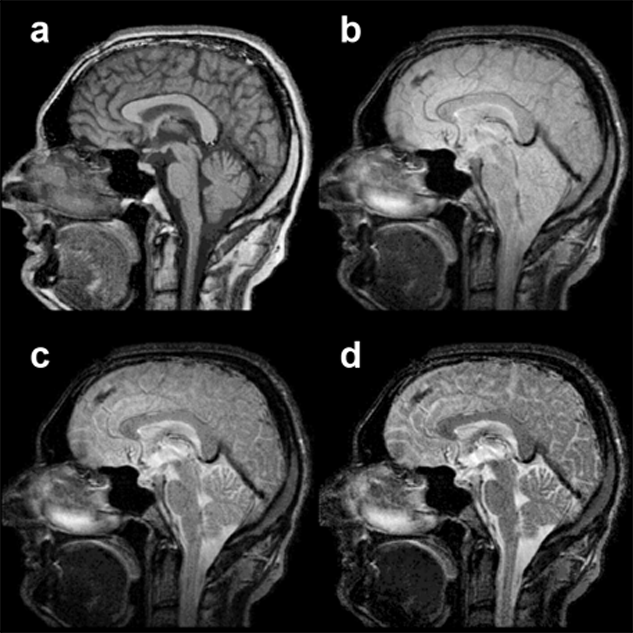
Figure 14-04:
Midsagittal slice through a normal brain. SE pulse sequence, from (a) T1-weighted through (b) and (c) intermediately weighted to (d) T2-weighted.
The fluid signal of CSF changes accordingly, and the flowing blood in the straight sinus stays black.
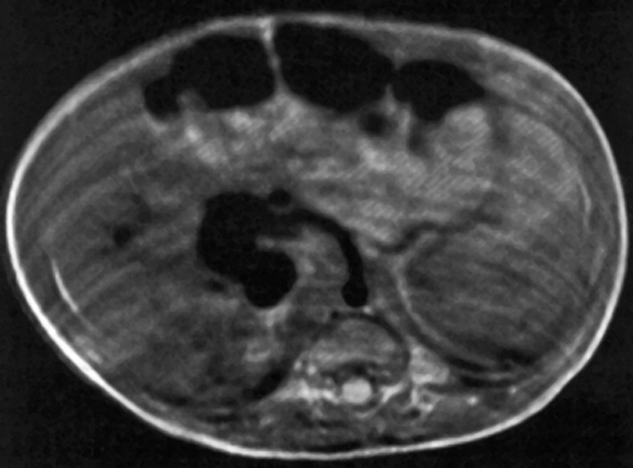
Figure 14-05:
Intermediately weighted SE image of an infant’s abdomen (disturbed by motion artifacts). The dark areas in the front are air-filled bowel loops. The dark structures in front of the spine represent rapidly moving blood in a porto-caval shunt.
 Figure 14-06 explains this phenomenon for blood. In spin-echo sequences, the time-of-flight (TOF) effect of inflowing blood is the main cause responsible for changes of the signal intensity behavior. This effect originates from the movement of the blood during the time between the application of the excitation and the refocusing RF pulses.
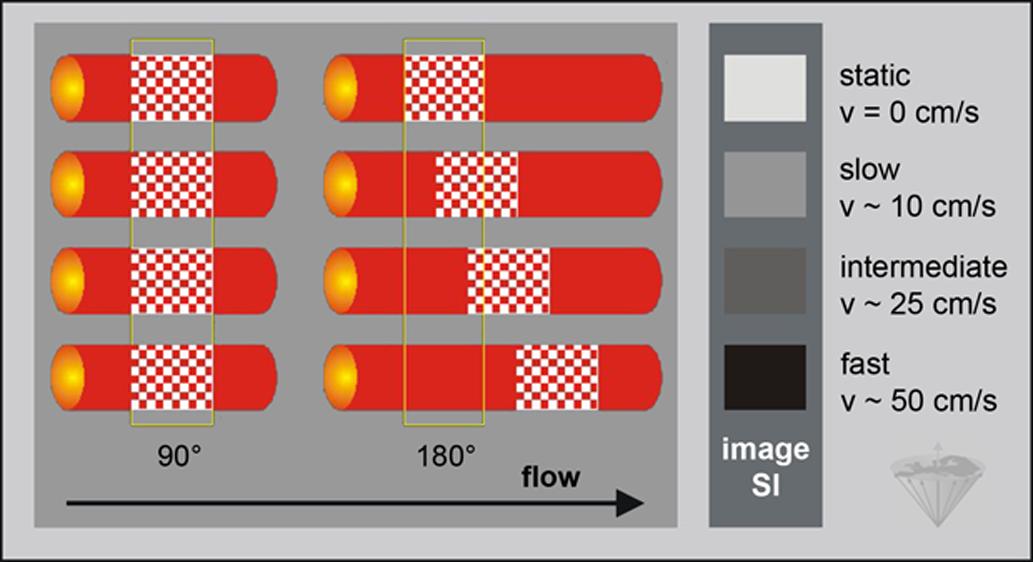
Figure 14-06:
Basic effects of time-of-flight flow phenomena upon signal intensities in spin-echo images. The same imaging plane is first exposed to a 90°, then to a 180° pulse. If there is no flow, a bright signal will be visible. Slow flow creates a signal intensity at the bright end of the gray scale, whereas fast flow leads to low signal or no signal at all (signal void). Now all excited spins have left the imaging plane by the time the refocusing 180° pulse is applied. SI = signal intensity; v = velocity.
Blood can move so fast (Table 14-01), that it is not subject to both the 90° and 180° pulses of an SE experiment, but only to one of them. Whichever pulse it is, no signal will be received from the moving blood; there will be a signal void. Turbulent flow contributes to this effect.
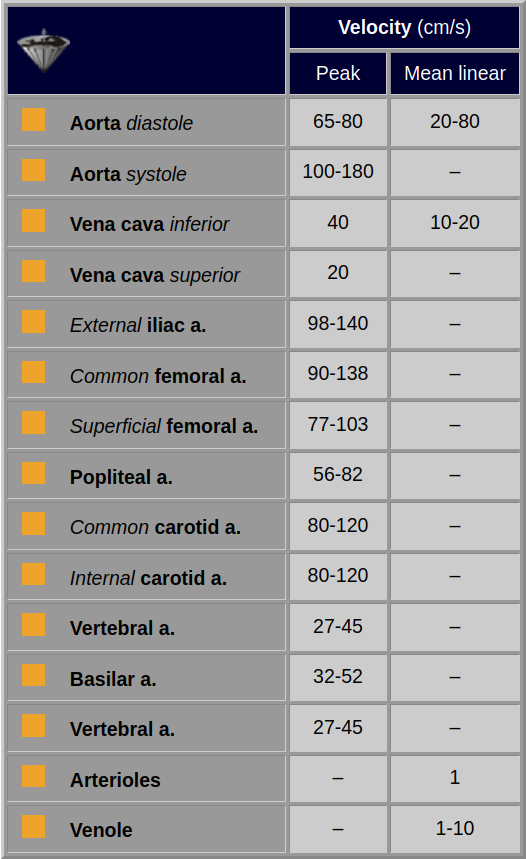
Table 14-01:
Range of values of blood velocities in the human body. a = artery.
A detailed description is given in the section about time-of-flight angiography.
Slice thickness and profile, T1 (and thus field strength), the repetition and echo times, and other intrinsic and extrinsic factors add to the extreme complexity of flow signals in MR images. Blood velocity is not the only factor influencing signal intensity.
In two-dimensional rapid imaging sequences using gradient echoes, the signal-intensity behavior is more straightforward than in SE images.
Here, stationary material experiences the effect of all applied RF pulses, resulting in a signal which is only a small percentage of the equilibrium signal.
In the presence of flow, the spins in the slice are replaced by spins which have not experienced any of the preceding RF pulses and therefore give a much greater signal, providing that the flow is not turbulent.
Two components contribute to the flow signal of a GRE sequence (Figure 14-07): Those spins which have entered the slice before the current excitation pulse and those excited by the preceding pulse that remained in the slice. The fresh spins traveling fastest carry full magnetization and contribute most to the signal; the partially saturated spins traveling slower contribute less. With increasing blood velocity, signal intensity increases until it reaches a steady state (Figure 14-08).
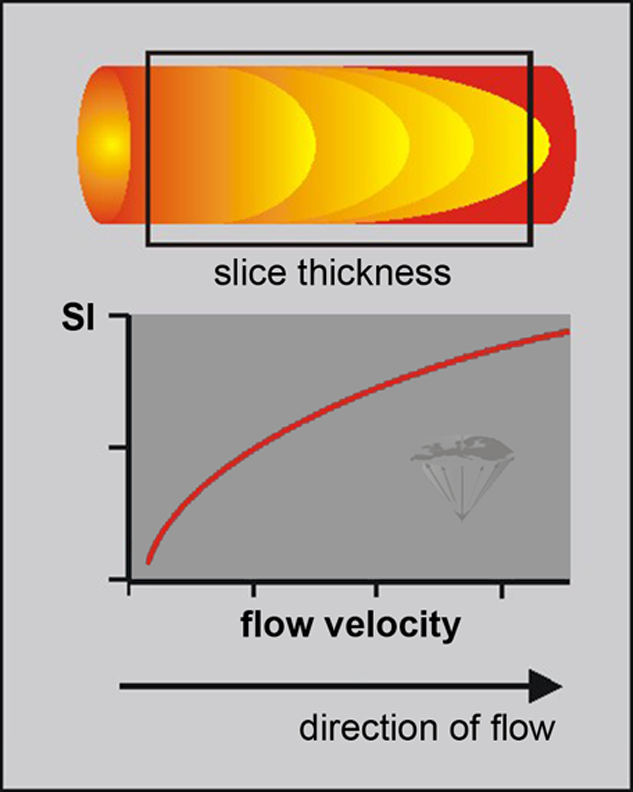
Figure 14-07:
Contributions to the flow signal of a gradient-echo sequence. SI = signal intensity (%).
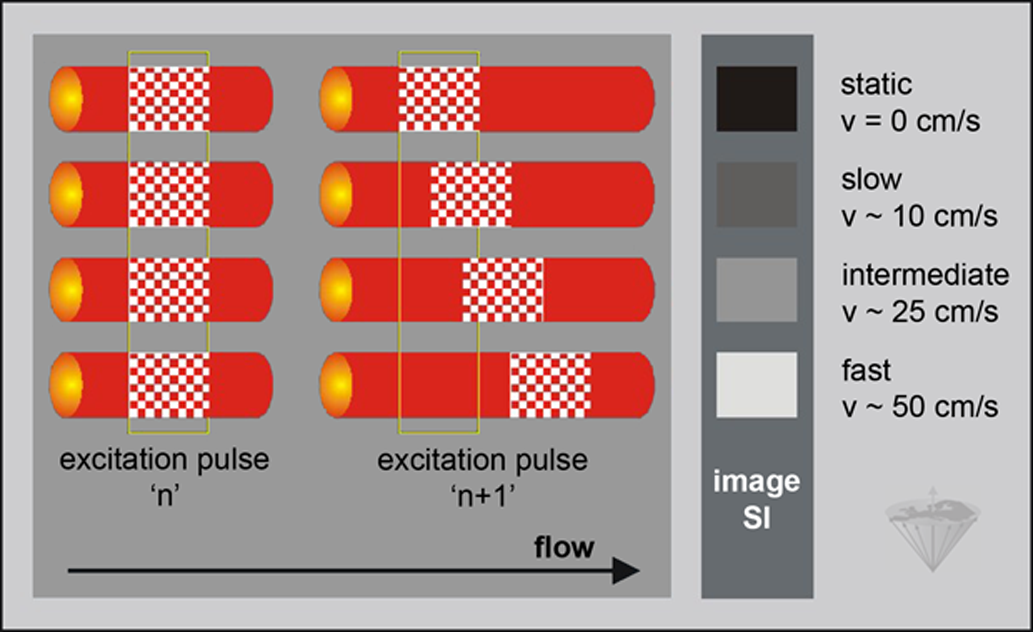
Figure 14-08:
Conceptualized flow signal intensity patterns of a GRE sequence in the steady state. The signal intensity is dependent on velocity: the faster the flow, the brighter the signal. SI = signal intensity; v = velocity.


|

|
|---|