


 arly on in MR imaging, blood vessels were visible. However, they could not be marked, singled out and made stand out as they could in contrast-enhanced x-ray angiography.
Figure 14-09 shows an example of high-signal blood in an examination of the pelvis. This behavior has been exploited for cardiac studies (Figure 14-10) and is fundamental to magnetic resonance angiography.
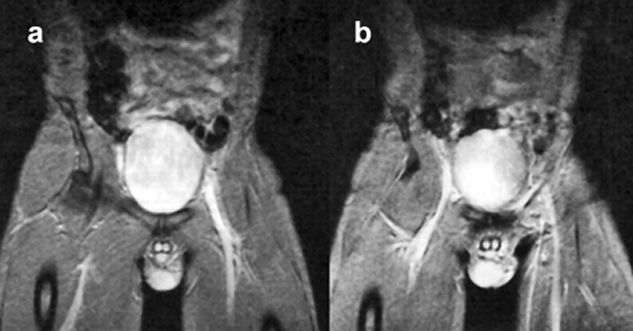
Figure 14-09:
In gradient-echo images, flowing blood appears bright. Note: These images are plain GRE images; they are not (yet) MR angiograms. Parameters: B₀ = 0.5 T; TR = 400 ms, TE = 28 ms, FA = 20°.
Figure 14-10 shows that in the spin-echo image, flowing blood within the heart chambers and the ascending aorta is black, whereas in the gradient-echo image, flowing blood appears bright.
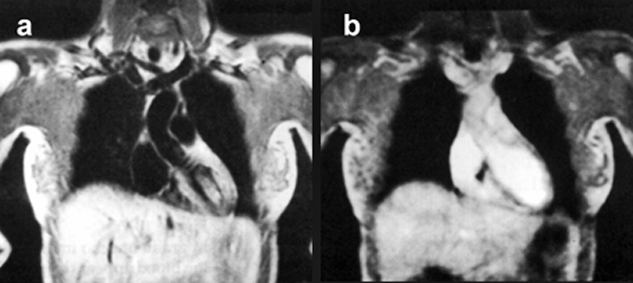
Figure 14-10:
Effects of blood flow upon signal intensity in a (a) spin-echo and a (b) gradient-echo pulse sequence.
MR angiography (MRA) is a further development of flow-related MR methods. In contrast to x-ray angiography, MRA does not require the use of contrast agents, rather the blood itself is used as an intrinsic contrast agent.
However, there are general problems with all MRA techniques which are difficult to overcome. They include flow voids or regions of low signal, where turbulent flow prevails, and difficulties in depicting smaller vessels.
 Two groups of techniques are used for directly imaging flow in arteries, veins, and CSF-containing spaces:
 time-of-flight (TOF) angiography, and
phase-contrast (PC) angiography.
time-of-flight (TOF) angiography, and
phase-contrast (PC) angiography.
Although both techniques are fundamentally different, they are markedly affected by normal and abnormal blood-flow patterns. TOF and PC are both bright blood methods, i.e., the blood appears bright on images. Both are available in two-dimensional or three-dimensional versions, and PC also as a cine-technique. The choice of methods depends on flow velocity, imaging time available, and a number of other conditions. Both techniques have advantages and disadvantages, which are summarized in Table 14-02.
Black blood techniques are derived from TOF methods. They depict flowing blood dark and are preferably used in regions with high turbulence, e.g., in the exact assessment of stenotic lesions.
Time-of-flight techniques were first described in 1959 by Jerome R. Singer [⇒ Singer 1959]. These techniques are also known as inflow or wash-in/wash-out techniques.
They take advantage of the contrast between inflowing fully magnetized blood and the saturated surrounding tissue (Figure 14-06). In this case, the flowing blood is bright, whereas the surrounding tissue is dark [⇒ Hausmann 1994]. However, this holds for a single-slice experiment only. If we move to multiple slices, flow effects become more complex — one has to consider the flow pattern of blood in vessels, as described earlier Figure 14-02.
Flow signal intensity and image contrast also depend on some of the principal extrinsic contrast parameters of MR imaging. In multiple-slice images, flow signal intensity is influenced by the position of the particular slice and the direction of flow relative to slice excitation. At the time of inflow, one slice of the flowing blood is excited. This excited blood continues traveling in laminar flow and leads to different signal patterns in the neighboring slices.
If flow direction and slice excitation direction are the same, the flow is called concurrent. Flow enhancement changes according to the direction of flow and sequence of slice excitation (Figure 14-11).
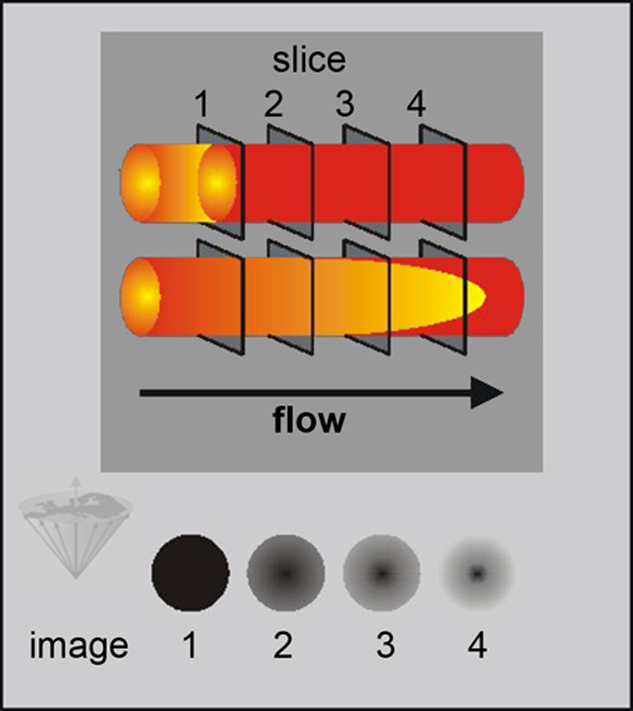
Figure 14-11:
Flow-related contrast enhancement in multiple slice SE images. The dark gray depicting the spins in slice 1 illustrates the fate of these spins while flowing through the imaged region. Because parabolic laminar flow possesses a higher velocity in the center, doughnut shaped patterns develop. This kind of flow enhancement is not pathological.
During the image-acquisition period, the volume-of-interest receives multiple RF pulses saturating the non-moving spins within the volume. Fully magnetized flowing spins enter the volume, presenting greater signal intensity than the stationary tissue. Reversing the slice-excitation direction changes this signal pattern (countercurrent flow). In this case, the central signal void is usually less pronounced but still visible.
The most common implementation is to acquire a series of parallel thin slices using a rapid GRE sequence, usually with flow-compensated gradients to minimize the dephasing effects.
Flow-compensation methods include such techniques as gradient moment nulling (GMN), motion-artifact suppression technique (MAST), and field even-echo rephasing (FEER). They return spins moving at a constant velocity along a magnetic gradient into phase at the same time as stationary tissue. This enhances blood (or CSF) signal intensity (Figure 14-12).
The blood flowing perpendicular, or with a perpendicular component, to the slices gives a strong signal. The series of slices are viewed on screen as a 3D stack forming a 3D picture of the flow perpendicular to the slice direction or as a single-projection image.
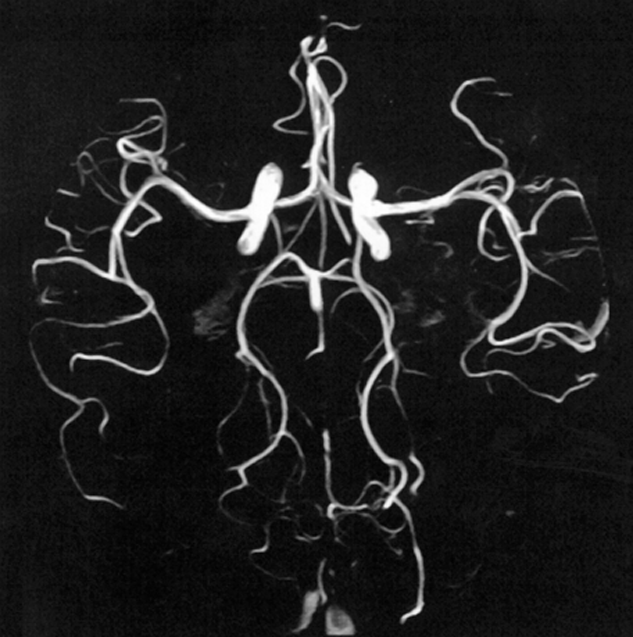
Figure 14-12:
Time-of-flight angiography.
Regular MR images are magnitude (modulus) images, with signal intensity being the basis for image reconstruction. Phase-contrast MR angiography exploits the shift in the phase that occurs when spins move and dephase in the presence of an imaging gradient (as discussed in Chapter 6) [⇒ Gedroyc 1994]. For flow perpendicular to the gradient, the motion will cause the spins to experience different gradient strengths. To counteract this force, the gradients are balanced for stationary spins and thus have no influence on these spins (cf. Figures 06-09 and 06-10).
The gradients, however, influence moving spins, leading to a net phase shift (Figure 14-13 and 14-14). Because of the balanced gradients, stationary spins in the surrounding tissue completely rephase. The flowing spins will stay out of phase. The phase angle depends on the flow velocity. This method has the advantage that its sensitivity can be adjusted to the velocity of moving blood or CSF.
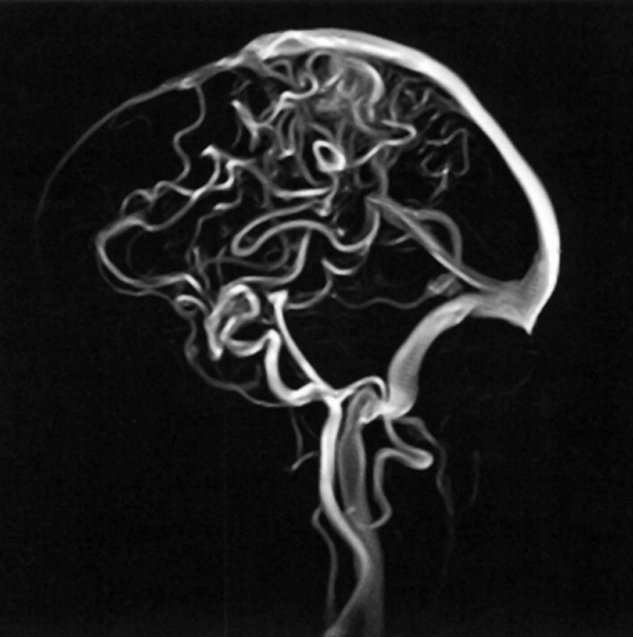
Figure 14-13:
Phase-contrast angiography.
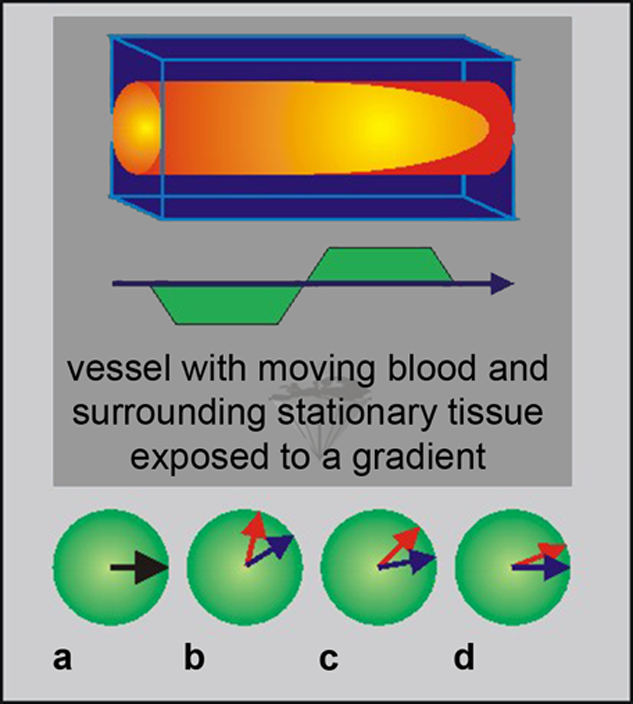
Figure 14-14:
Phase contrast. (a) Spin system at time 0; (b) spins are dephasing; (c) after switching of gradient spins are rephasing; (d) stationary spins are rephased.
The red dephasing arrows represent flowing spins; the blue dephasing arrows represent stationary spins.
Weak gradients allow the detection of fast-moving flow, whereas strong gradients are more sensitive to slow flow.
Because the velocity of blood flow differs in the human body, as seen in Table 14-01, which is a great advantage of the PC method. The size of the phase shift depends on the gradients, the time separating them, and the flow rate. Thus, for known gradient parameters, the flow rate can be calculated. In this way, PC angiography can produce quantitative velocity-encoded images or, in general, velocity mapping.
Because PC techniques depend on encoding of flow in all three spatial directions, data acquisition takes longer than for TOF methods — after acquisition of a reference phase image, up to three images sensitized to flow in the three directions have to be collected; to eliminate the stationary background signal, the reference phase image is then subtracted from each of the three sensitized images.
Similar considerations hold for 2D versus 3D: 2D acquisition is faster, 3D acquisition has better signal-to-noise ratio and spatial resolution.
When acquiring PC-MRA images, one has to know the approximate velocity of the flowing blood, the velocity-encoding (VENC) value. This value represents the maximum velocity present in the imaging volume.
The faster the spins in the vessel are moving, the greater their phase shift will be. Spins with a higher velocity than the VENC value will cause aliasing artifacts on the final image (wrap around artifact; see Chapter 17).
An overview of TOF and PC characteristics is given in Table 14-02.
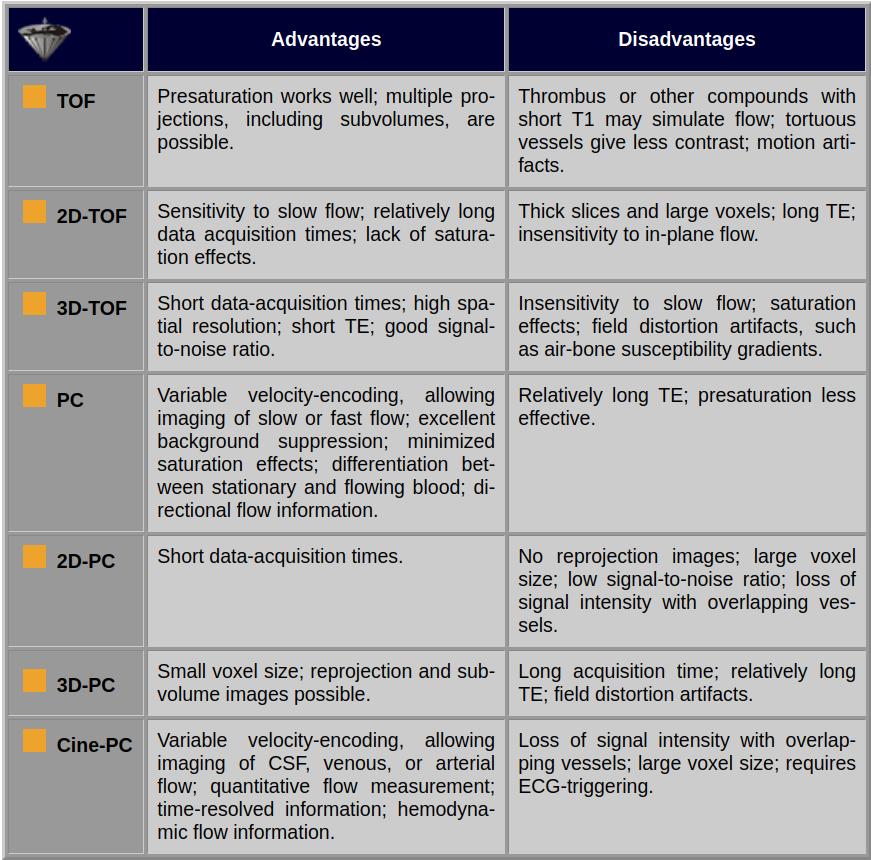
Table 14-02:
Advantages and disadvantages of various TOP and PC imaging techniques used for MRA.


|

|
|---|