


 ith both time-of-flight and phase-contrast methods we now have isolated vascular structures by acquiring individual two- or three-dimensional images. However, an angiogram reflects entire vascular structures in a two- or pseudo three-dimensional overview.
In conventional x-ray and digital subtraction angiography, this is created by subtraction of a mask from the contrast-enhanced angiography images. In MR angiography, a special computer algorithm is used for this purpose — the maximum-intensity projection (MIP).
Vascular structures on MR angiography images show bright signal intensity.
The MIP algorithm allows the selection of bright pixels in all parallel 2D slices or in the 3D slab or volume and their projection into one image. The projection method is similar to a shadowgram, with the exception that only high-signal-intensity pixels are projected into the final image. The corresponding pixels in each original image finally form the projection angiogram.
In 2D imaging, this is easily understandable as depicted in Figure 14-15.
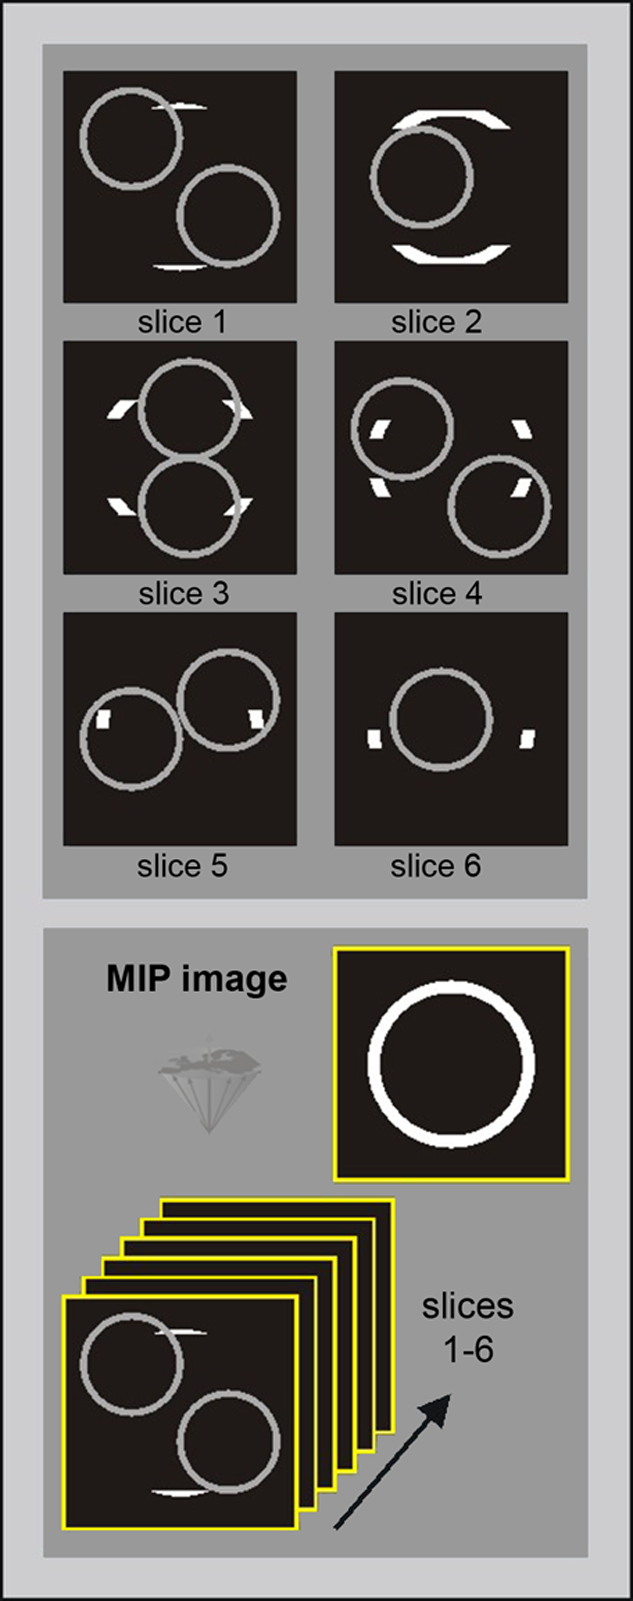
Figure 14-15:
The MIP operation. In this case, six slices have been acquired.
The figure shows how flow-related structures give the highest signal intensity (the big white circle on the final reconstructed image); however, there are other structures visible with intermediate signal intensity (small gray circles on the original images).
Only the highest valued pixel is represented on the final image. Thus, other structures disappear.
In 3D imaging, this algorithm can be used to create images in any projection wanted. On screen, one can visualize a rotating 3D angiogram.
 MIP is a relatively simple and useful technique for processing angiographic MR data. It has some drawbacks such as the lack of discrimination between arteries and veins and high-signal-intensity non-vascular structures such as fat. New methods are being developed to overcome these problems, among them vessel tracking and volume rendering.
One disadvantage of MIP is that in routine clinical angiography bright non-vascular tissues (e.g., fatty tissues) can represent highest signal intensity on the original pictures and thus be depicted on the angiogram. Such tissues can only be discriminated from vascular structures by their anatomy.
For black blood angiography, the contrary of MIP is done: those pixels with the lowest signal intensity are chosen, and with minimum-intensity projection (mIP) a black blood angiogram is created.
Saturation effects are the gradual loss of T1 signal intensity by repeated excitation pulses. Too short TR leads to progressive loss of Mz; the same happens when the flip angle is increased.
Saturation effects associated with thick slabs can be partly overcome with a technique called multiple overlapping thin slabs acquisition (MOTSA). Instead of one thick slab, several smaller slabs are acquired.
However, MOTSA creates the Venetian Blind artifact (Figure 14-16). Such artifacts do not exist when one uses Tilted Optimized Non-saturation Eexcitation, TONE. TONE applies ramped flip angles to the different slices of the slab. Increasing the flip angle counteracts saturation effects, in this case of slow flowing blood in deeper slices.
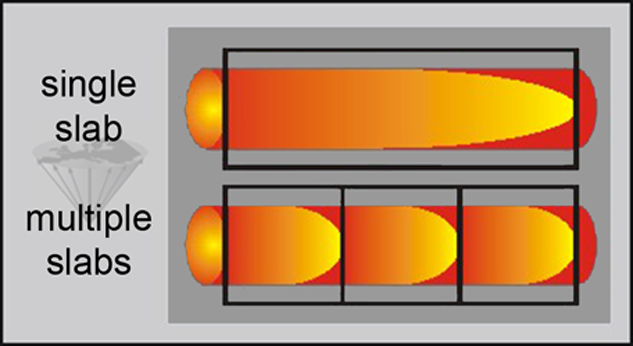
Figure 14-16:
MOTSA (multiple overlapping thin acquisition).
Combined with magnetization transfer contrast (MTC), which suppresses background signal from brain parenchyma, TONE boosts the visibility of small vessels (Figure 14-17).
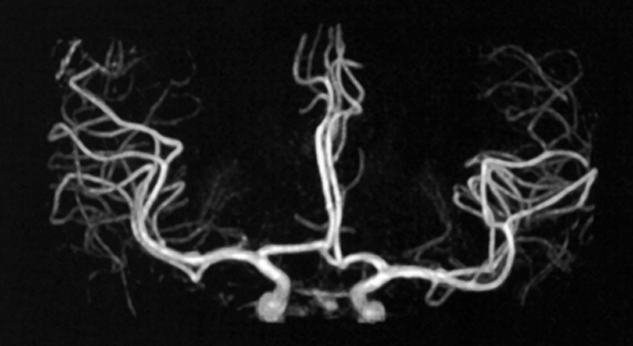
Figure 14-17:
Brain angiogram using TONE and MTC


|

|
|---|