


 asically all digital images are processed in one kind or another. When reading MR images, one always should be prepared for the unexpected. Digitized imaging brings more of the unexpected into our lives. Still, there are some easily recognizable features in most images (Figure 15-01).
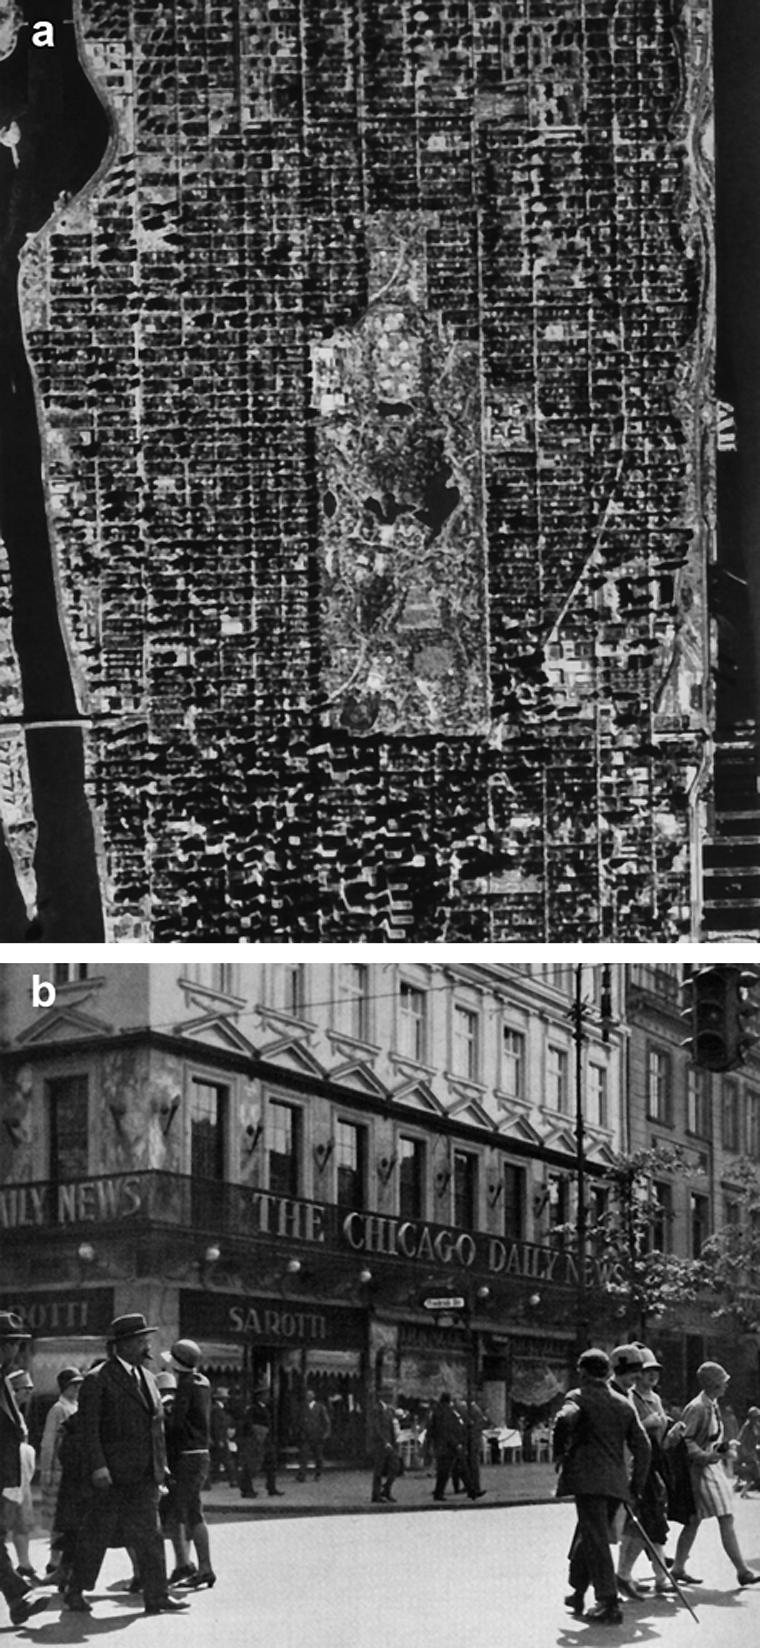
Figure 15-01:
Where and when were these pictures taken — and what do they show? Think twice … the answers are here.
Image processing was already on its way to becoming an established field of research in its own right when clinical MR imaging equipment became available in the early 1980s. The digital nature of MR imaging, coupled with a wide range of applications, spurred an enormous activity in image-processing of MR imaging data in the last fifty years.
Computer assisted detection or diagnosis (CAD) systems were developed to find and highlight suspicious regions or structures in images of the human body by pattern recognition. They are employed in, e.g., the search for breast, bone, lung or metastatic cancer. These artificially intelligent (AI) systems can show astonishing performance. However, they can also cause misclassification of images caused by hardly perceptible perturbations in the image data and thus become detrimental. The reason for such failures are unknown [⇒ Szegedy 2014].
In this chapter we give a brief description of image-processing techniques that have been applied to MR imaging. We also describe the somewhat related field of visualization techniques, with a special focus on 3D visualization methods. Some of the methods mentioned here relate directly to the next chapter on dynamic imaging.
Involuntarily, image processing can add to the existing delusion and bias in image reading and lead to preconceived but wrong diagnoses (Figure 15-01 and Figure 16-01). Unrecognized optical and mental illusions caused by artifacts created by image-processing algorithms may amplify such errors (Figure 15-02). These problems are beyond the scope of this introduction to MR imaging; they are treated in detail elsewhere [⇒ Frisby 1979].
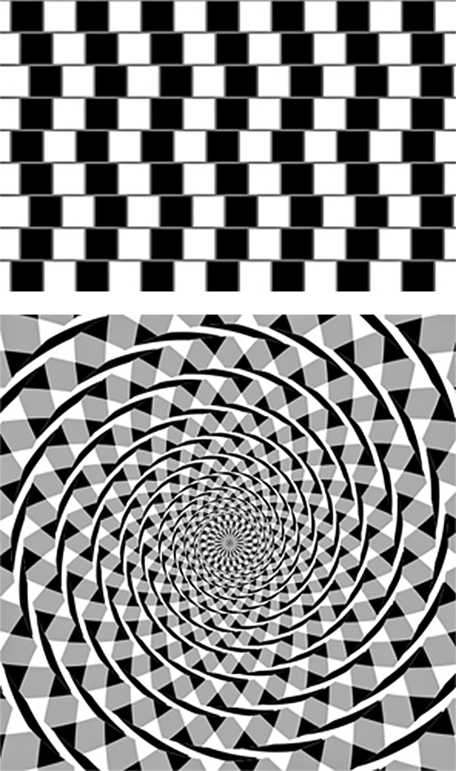
Figure 15-02:
Top: The coffee house wall illusion — in reality all lines are parallel.
Bottom: Fraser's spiral — in reality there are only circles.
 The pictures on the top of the page … the answers to the questions: Where and when were these pictures taken — and what do they show?
These questions were just asked to confuse you. You might have thought the answers are easy. Of course, they are.
(a) Where: A bird’s-eye view of Central Park in Manhattan. Wrong: This is a vodka commercial with a vodka bottle which looks like Central Park. This picture has been image-processed — and on this picture the East River is in the west, not in the east.
Even if you believe that you know what you are seeing — think twice.
(b) When: Correct — before World War II (in 1928). Where: You are wrong — not in Chicago (even if there is a commercial for the Chicago Daily News), but in Berlin (at the corner of Unter den Linden boulevard and Friedrich Strasse in the city center).
Learning point: Always check the patient’s history before you read your images and make a diagnosis — even when using AI support.


|

|
|---|