


 he introduction of color images is a recurrent and lasting topic in diagnostic imaging. The contribution of colors to imaging diagnostics, in particular high-resolution images, is much debated; colors do not add any provable diagnostic facts. All digital images are per se gray scale images. They can be 'artifically' colored (pseudo colors). MR images are always gray-scale images; colored MR images are only used as show effects. In diagnostic MR imaging, colors lack the dynamic range of gray scale images and image windowing is not possible.
However, pictures of a number of MRI offsprings (e.g., MR angiography, dynamic contrast-enhanced MRI, functional MRI, MRI tractography, PET-MRI fusion images) often contain overlayed colored areas representing usually the lower resolution imaging technique.
Colors are subjective qualities. They might confuse, bias, and lead to a loss of information. In general, their perception is not well understood.
 One example is the semiotics of color-coding in BOLD imaging: Colors are assigned to degrees of statistical significance, then turned into colored pixels, combined into blots, and overlayed on high-resolution MR brain images to reveal 'brain activation', i.e., regions of relatively more or less blood in an excited state compared to a rest state.
However, the color scale used elicits a biased reaction in many observers — obfuscating a neutral interpretation of the results (for details cf. Chapter 11).
Another problem is the human eye. In the central part of the retina, there are approximately six million cone cells which are responsible for color vision. However, 8% of the male population and 0.5% of the female population in Europe and North America suffer from a color vision deficiency.
The most common one is deuteranomaly where people (among them radiologists) perceive green, red and purple as a grayish shade and are unable to identify red or green colored areas of these images (a simulation is shown in Figure 15-03).
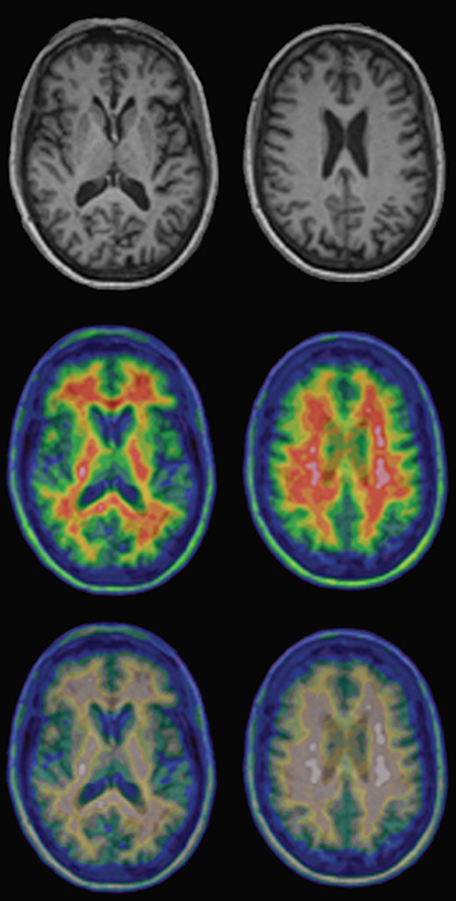
Figure 15-03:
Top: Regular T1-weighted gray-scale MR images of a healthy volunteer.
Center and bottom: PET-MRI fusion images of the same person. The upper row of the pseudo-color images shows the normal images; the lower row shows the same images as seen by a person with red-green deficiency (deuteranomaly).


|

|
|---|