


 he spectrum of clinical MR examinations has hardly changed during the last decade. Brain and spine studies make up more than 50% of all studies, breast, heart and interventional studies less than 5%. fMRI (functional brain MRI) and other sophisticated examinations add up to less than 1% of all clinical MR studies (Figure 21-01). Of course, the local distribution differs according to the specialization of the MRI institute.
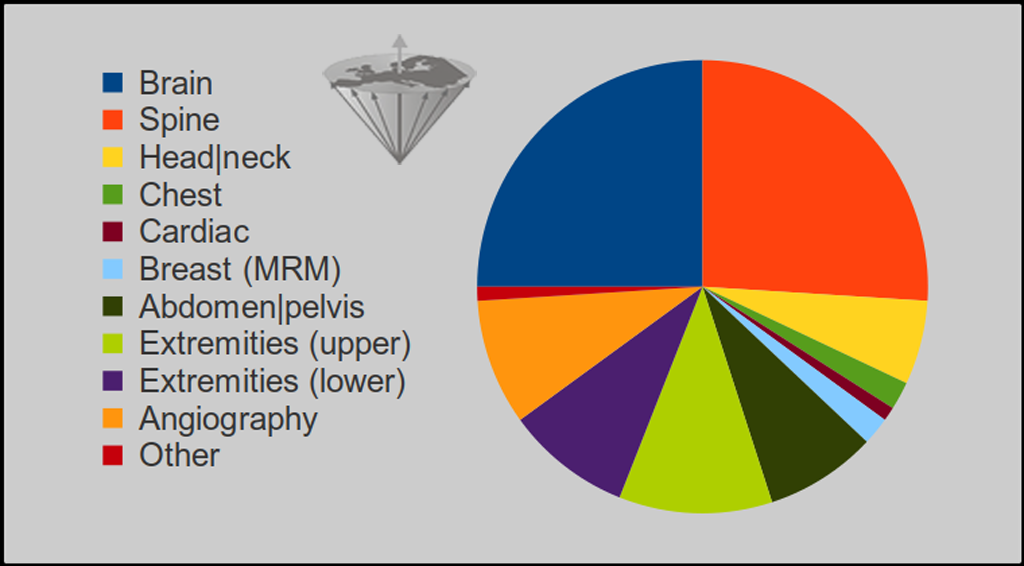
Figure 21-01:
Overall MR examinations in percent:
Spine 26%; brain 25%; head and neck 6%; upper extremities 11%; lower extremities 9%; abdomen and pelvis 8%; chest 2%; breast (MRM) 2%; cardiac 1%; angiography (MRA) 9%; other ≤ 1%.
Source: TRTF/EMRF estimates 2023.
Notes:
• Relative distribution of MR examinations by organ or applications given in Figure 21-01: The percentage will only slightly change in the future. However, the absolute number of examinations will drastically increase — not necessarily for medical reasons, though. There is, for instance, no evidence to justify whole-body screening for people without clinical symptoms or known or imagined risk factors.
• For the "Facts and Figures" section we try to collect data through our own channels. The numbers published by OECD (Organization of Economic Cooperation and Development) and WHO (World Health Organization) are not absolutely dependable, but the best collected data available from international organizations. In many instances, OECD data do not contain the number of units in freestanding imaging facilities nor those of state or military owned facilities. In many countries even the responsible state administrations (ministries of health) cannot provide reliable numbers, nor can the manufacturers of MR equipment and those of accessories. For some countries, the number given here may substantially differ from those distributed by OECD and WHO. They were collected from insurance or reimbursement companies or private sources.
As for "Facts and Figures"
one should listen to Mark Twain:
 Lies, damned lies, and statistics.
In the early 1980s, there were 12 machines, and everybody working with MR imaging knew each other. Today, we can just give an impression of magnitudes, a general trend. Worldwide, there are perhaps 50,000 MR machines. At present, about 5,000 MR imaging units are sold worldwide every year. Usually, after an average of seven years, many machines are being replaced or refitted. Therefore the overall number of machines sold does not represent the number of machines in use.
In general, twelve to fifteen machines per one million inhabitants fully satisfy the medical needs of the population. Figure 21-02 gives an overview of the number of MR units in some exemplary countries worldwide.
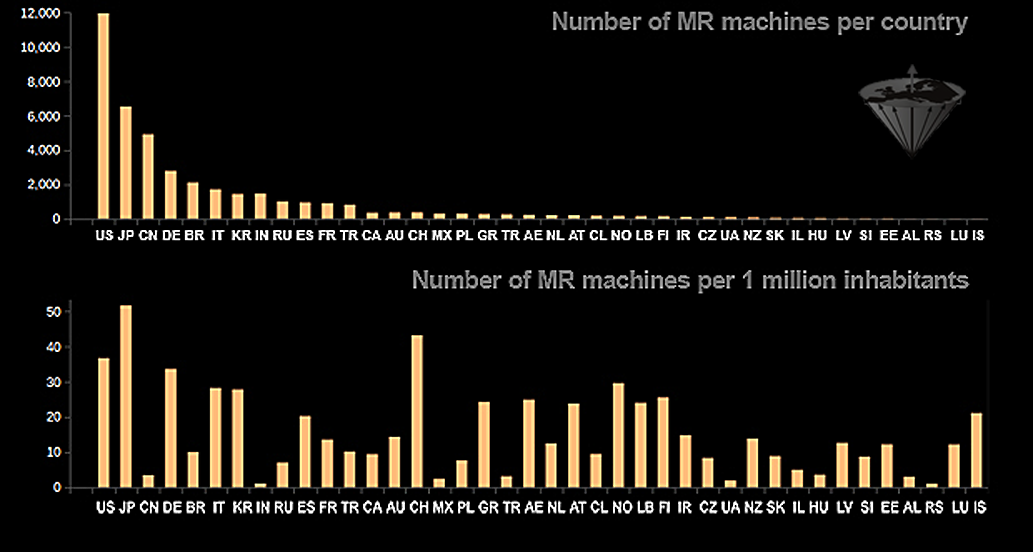
Figure 21-02:
Top: Overall number of MR machines in some selected countries. Bottom: Machines per 1 million inhabitants (TRTF/EMRF estimates, 2020).
US U.S.A.; JP Japan; CN China; DE Germany; BR Brazil; IT Italy; KR South Korea; IN India; RU Russia; ES Spain; FR France; TR Turkey; CA Canada; AU Australia; CH Switzerland; MX Mexico; PL Poland; GR Greece; AE United Arab Emirates; NL The Netherlands; AT Austria; CL Chile; NO Norway; LB Lebanon; FI Finland; IR Ireland; CZ Czech Republic; UA Ukraine; NZ New Zealand; SK Slovakia; IL Israel; HU Hungary; LV Latvia; SI Slovenia; EE Estonia; AL Albania; RS Serbia; LU Luxembourg; IS Iceland.
OECD data for 2022 can be found [⇒ here].
In countries with (over-) saturated markets, e.g., the U.S.A., Japan, Korea, Switzerland, and Germany, there is a high risk of overuse of MR imaging. According to the OECD [⇒ OECD], between 1997 and 2006, the number of examinations in the U.S.A. has increased dramatically while the occurance of illnesses remained constant. Furthermore, where payment incentives allow companies and physicians to benefit from referrals, the likelihood of overuse increased.
One also has to see the change of radiologcial health care:
From individual to chain-employed radiologists.
The choice of an MR system might be quite agonizing. Field strength is one, but not the only and most important, parameter; higher field strength does not guarantee a better quality system or better diagnostic outcome for the patient. Most appraisals of the "best" equipment are subjective opinions sold as research backed unshakable conclusions. Since there are very few scientifically reliable outcome studies, any claims about superiority of equipment types or best field strength must be looked at cum grano salis (see also Diagnostic accuracy).
Needs must be carefully assessed in the choice of an MR imager. The quality of the component parts, both in terms of hardware and software, makes a considerable impact. Service, maintenance, and knowledge of how to run the system are of pivotal importance for image quality and assessment.
There is no optimum field strength for MR imaging (see Table 03-03 for a comparison between 1.5 T and 3.0 T). Certain MR-based techniques such as functional imaging need high fields, clinical MR imaging doesn't. The diverse nature of applications requires different systems operating at an appropriate field; there is no single perfect or ideal field strength for all clinical indications and/or research questions. Image contrast does not necessarily increase with field strength (see Figure 10-16).
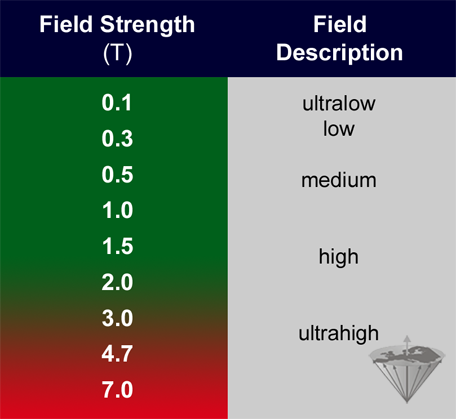
Figure 21-03:
Definition of field strength (EMRF 1989). Definitions in publications on MR topics and in sales brochures change according to commercial and scientific marketing schemes and prevailing scientific dogma.
Ultralow equipment (≤ 0.1 T) is hardly used any more, most clinical machines operate at medium and high fields. At present, there is a trend towards ultrahigh research machines, operating between 3 T and 11 T (Figure 21-03) aimed at research and commercially competitive sites. At present, there is no proof that such units are of better clinical value than medium or high field machines although there are numerous claims of better "patient outcome". Manufacturers try to push them into the clinical market, although it is unlikely that they will be used in clinical settings because of their side effects and enormous prices.
MR systems are available in the well-known tunnel shape or as open systems. The latter reduce patient claustrophobia and are better suited for interventional purposes because there is access to the patient from all sides. Open systems are available between 0.3 T with permanent magnets to 1.5 T with superconducting magnets.
Some thoughts written about buying an MR eqipment
in the early times of MR imaging …


|

|
|---|