


 he stronger the MR signal, the better image quality will be. Owing to the low intensity of the magnetic resonance signal, it is often strongly influenced by background noise, just like radio signals coming from remote transmitters.
The quality of the signal is described as the signal-to-noise ratio (S/N or SNR). The aim in medical imaging is to get a combination of both the best possible signal-to-noise ratio and the best available contrast in the shortest time possible.
One method of improving SNR consists of data averaging. When a magnetic resonance experiment is repeated, and the magnetic resonance signals obtained are recorded each time, they will add up. The random or chaotic positive and negative noise signals will also add up with the number of excitations, but at a lower rate because of the statistical nature of the noise.
For many MR imaging data acquisitions, two data averages suffice for the creation of images with good SNR. For n data-averaging runs, the net increase of S/N will be the square root of n. The S/N will, for example, increase by a factor of 2 if four data averages (numbers of excitations) are performed (Figure 09-07 and Figure 09-08).
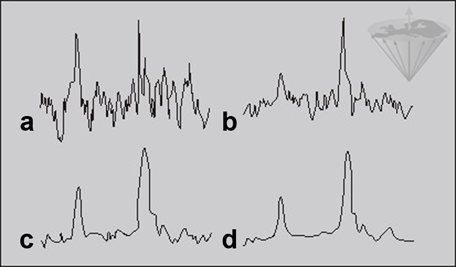
Figure 09-07:
a 2; b 8; c 32; and d 128 data averages. The ‘polluting noise’ disappears slowly with higher number of averages.
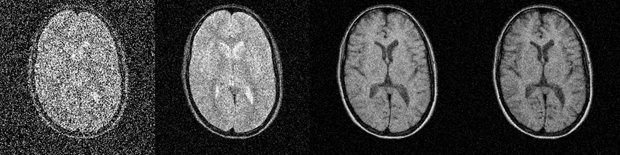
Figure 09-08:
Improvement of signal-to-noise with increasing number of signal averages.
Simulation software: MR Image Expert®
The signal-to-noise ratio increases with field strength; theoretically it is proportional to the square of B₀. In analytical NMR, which uses small samples and no field gradients, signal-to-noise levels vary linearly with field strength.
In clinical MR imaging, the ratio of signal-versus-noise versus field flattens out beginning at approximately 0.2 Tesla, resulting in diminishing gains with increased field strength (Figure 09-09).
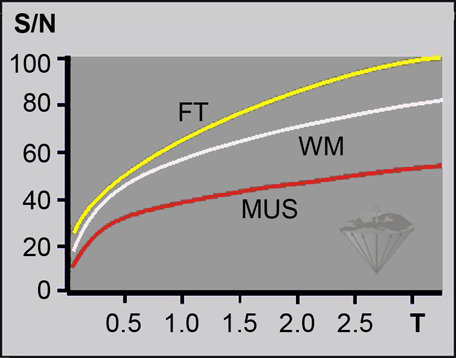
Figure 09-09:
Behavior of the relative signal-to-noise ratio (S/N, in percent) versus field strength in a T1-weighted pulse sequence. The best possible increase is been depicted.
(FT = fatty tissue; WM = white matter; MUS = muscle).
Until 0.2 Tesla the SNR increases linearly with field strength, then the rate flattens. In gray and white brain matter, the difference between the SNR at 1.5 Tesla and 3.0 Tesla is only 30-60%, not as theoretically expected 100%. It is claimed that beyond 3 Tesla the increase becomes very difficult to project or to measure; the SNR for clinically useful images can even drop [⇒ Springer 2016].
Increasing complexity of MRI systems also leads to a perplexing intricacy of SNR and its determination. Measurements must be done at the exact spatial source of the signal to be correct; in many cases, this is hampered by different relaxation times at different fields, RF coil types, altered sequence parameters including pulses, inter-pulse delays, flip angles, and acceleration factors, novel reconstruction algorithms, filters, or, e.g., by parallel imaging techniques. For comparisons between different field, often scientifically non-fitting pulse sequences are applied.
While at low magnetic fields one can assume that SNR is relatively homogeneous throughout the examined object, e.g., the brain, at ultrahigh fields its distribution can vary drastically.
One study showed that the SNR at 7 T versus 4 T was approximately 100% higher in the center of the brain whereas in the periphery the SNR gain was only approximately 40% [⇒ Ugurbil 2014, ⇒ Vaughan 2001].
Effects of RF inhomogeneity can leave substantial brain areas with suboptimal SNR and contrast-to-noise ratio. They incline to raise signal intensity at the image center. Attempts are made to mitigate such effects, but such techniques may induce additional artifacts.
 The most important factors influencing the signal-to-noise rate:
Relaxation times: T1 increases substantially with field strength; this leads to a loss of signal at a given repetition time TR. With increasing susceptibility effects at higher fields, T2* and T2app decrease, thus adding to signal loss.
Resistance of coils and sample: The intensity of noise depends on both electrical resistance in the coil and conductance losses in the human body, [Chen 1986, ⇒ Hoult 1986] but is dominated by the losses in the human body at resonance frequencies above ∼10 MHz (∼ 0.2T).
The body composition (size, inhomogeneity, susceptibility effects, and fat/water misregistrations) leads to additional electric noise.
While images of hands, feet, and knees can be visibly better at higher fields, the increase of SNR in head and body images is smaller.
Limited RF power due to SAR restrictions and limitations in the design of homogeneous RF coils add to the signal loss.
Field gradients: MR imaging requires field gradients to encode spatial information. They must be large enough to compensate for the inhomogeneity of the magnet and the chemical shift between fat and water.
As the field strength increases, so does the magnitude of both the field inhomogeneity and the chemical shift. Therefore, increased gradients are needed at higher fields if chemical-shift artifacts are to be satisfactorily suppressed.
If the gradient strength is doubled, then the bandwidth per pixel is also doubled. Unfortunately, this increases image noise by a factor of √2. The net gain in S/N provided by doubling the field is therefore not twofold, but the square root of two. Higher bandwidth reduces SNR.
Artifacts: Higher fields suffer increasingly from image artifacts [⇒ Sepponen 1996].
Critical remarks. At present, research in this field is very much in a state of flux [⇒ Hoult 2000] and only partly suitable for presentation in a textbook.
Diagnostic accuracy can be independent of field strength; the only two ROC (receiver-operator characteristics) studies available demonstrated diagnostic equivalence between low-field and high-field in brain studies and joint examinations, as well as in kidney, shoulder, and spine studies.
ROC studies comparing, e.g., 1.5 T and 3.0 T or higher fields are not available. One cerebral study showed a small, but significant superiority of 1.5 T, another one comparing 0.5, 1.0, and 1.5 Tesla stated that relative contrast was not related to field strength. Images obtained at 1.0 and 1.5 T were considered superior to images obtained at 0.5 T, but excellent image quality was obtained at all three field strengths [⇒ Merl 1999, ⇒ Rutt 1996, ⇒ Maubon 1999].
Because of the complexity of the subject, a number of published studies on SNR — not only those at high and ultrahigh fields — lack the necessary accuracy of measurements and calculations leading to contradictory and not reproducible results and conclusions.
Commonly, pulse sequence parameters are not well adapted to field strengths or the researchers worked with ‘black box’ machines where parameters could not be properly adjusted, in particular on high and ultrahigh field equipment [⇒ Springer 2016].
At times, rather wishful thinking and commercial interests than exact science seem to lead to the published results. The validity of most of the comparison studies is fairly limited. Instead of a Diagnostic Accuracy Score some publications offer a Diagnostic Confidence Score which is a subjective and biased measure based on personal opinions on image appearance that fails to take into account incorrect diagnoses, in particular if it is not a blind test.
Details of how to compare images taken with different parameters and at different field strengths are given in Chapter 10.


|

|
|---|