


 he influence of temperature on relaxation times is well known from analytical NMR (Figure 09-14). Temperature also influences the diffusion coefficient and the chemical shift of the water peak.
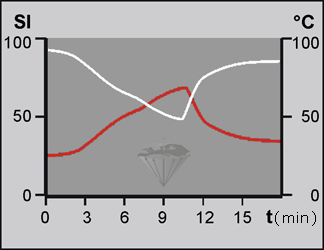
Figure 09-14:
Drastic change of temperature. The white curve shows the decrease of signal intensity of a T1-weighted pulse sequence before, during and after local heating (red curve) of brain tissue in an ex vivo experiment. The temperature changes from 25° C to more than 60° C; relative SI drops by 50%.
SI = relative signal intensity; temperature in °Celsius, time (t) in minutes.
Thus, the question arose if in MR imaging temperature changes in the human body may influence relaxation times of tissues and therefore contrast. This might occur, for instance, in patients running high temperatures one day when undergoing MR and having normal temperatures during a follow-up examination.
However, relaxometric measurements proved that any differences created are within the system error and are not to be expected to influence contrast in imaging of patients [⇒ Rinck 1987].
 Thermometry. The commonly used approach to magnetic resonance thermometry is not based upon relaxation times measurements, but on changes of the resonance frequency caused by temperature changes.
In water, the electrons shield the nucleus from the magnetic field and thus decrease the hydrogen resonance frequency. However, as the temperature increases, hydrogen bonds reorganize and the electron shield of the protons from the magnetic field gets even stronger, reducing the net field the protons are exposed to.
Their resonance frequency increases and this change can be measured and related to temperature. This process is described as as proton resonance frequency shift (PRF or PRFS) thermometry. It is calculated from a series of gradient echo images [⇒ Rieke 2008]. Temperature-related effects can be mapped dynamically [⇒ Hynynen 1997, ⇒ Le Bihan 1989, ⇒ Matsumoto 1994].


|

|
|---|