


 here is only one step from picture elements to image contrast. Contrast describes the relative difference of intensities of two adjacent regions within an examined object on a gray or color scale: their visibility. It is a quite controversial term in medical imaging.
Several definitions have been proposed over the years.
It is difficult to give an exact definition on a conventional analogue x-ray image. It is merely qualitative, except when using a special measuring device — or digitizing the analogue image.
Digitalization of images in nuclear medicine and x-ray CT opened the door to more straightforward quantitative approaches. Now, picture elements are available whose gray-scale intensity can be expressed in numbers. The numerical difference between two intensities allows quantitative definition of contrast.
If there is no difference between two neighboring pixels, they cannot be distinguished: no contrast exists. The bigger the difference in the intensity of two pixels, the better will be the contrast (Figure 09-06).
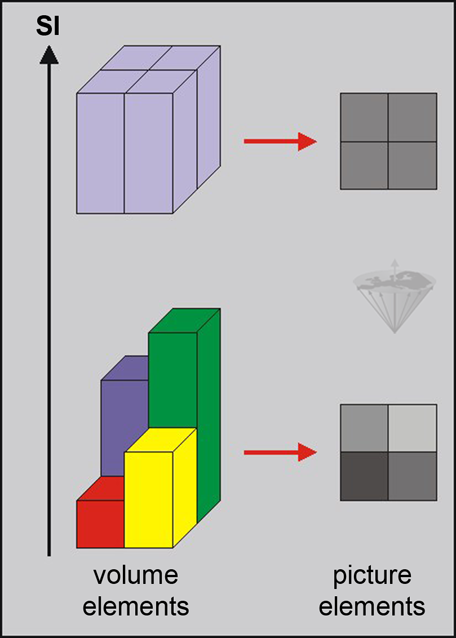
Figure 09-06:
Two examples of four neighboring volume elements.
Top: In the first case the four voxels have the same relative signal intensity (SI), and in the resulting image they cannot be distinguished from each other.
Bottom: In the second case, they have different relative intensities and thus they can be distinguished from each other in the final image.
The common quantitative definition of contrast is given by the following equation which was adapted from the original expression for optical visibility as proposed by Michelson in 1927 [⇒ Michelson 1927]:
where C is contrast and Ia and Ib are the signal intensities of two adjacent pixels or voxels.
It is important to understand that signal intensity in magnetic resonance imaging is not standardized. MR imaging does not possess any correlation to Hounsfield units in x-ray CT. The signal intensity of an MR image can represent a mixture between T1-, T2-, and ρ-values, flow, diffusion, perfusion, and other factors influencing the signal emitted by structures within a volume element.
Only normalization of images, e.g., with a water-filled vial outside the patient's body, allows an approximation to be made and can be used to calculate relative signal intensities, which then can be compared. However, these values are only semiquantitative. They vary between different MR equipment and have no diagnostic value.


|

|
|---|