00-f5 Title and Logo 00-f6
 guide Contents
 siteinfo Site Info


Chapter 9

09-01
Volume and Picture Elements

09-02
Image Matrix and Field-of-View

09-03
Spatial Resolution and Partial Volume Effects

09-04
Definition of Contrast

09-05
Signal-to-Noise

... and Data Averaging
... and Field Strength
09-06
Contrast-to-Noise Ratio
09-07
Age

09-08
Temperature

09-09
Image Windowing


09-07 Age

The composition of tissues in the human body changes with age. This is of par­ti­cu­lar importance in the brain, where the water content decreases and the myelin content increases dramatically during the first years of infancy.

Consequently, T1 and T2 relaxation times of brain tissue decrease. At birth, the infant brain consists of 93-95% of water and has long T1 and T2 relaxation times (Figure 09-12). There is a fast fall in water content to 82-84% during the first two years of life as myelination takes place.
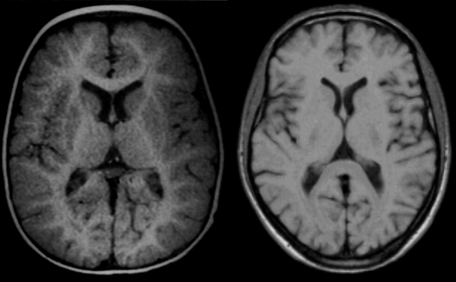
Figure 09-12:
Brain images of (a): an infant of 11 months, and (b): an adult at 0.5 T. The same pulse parameters were used (SE: TR = 500 ms, TE = 20 ms). Windowing is slightly dif­fe­rent.

Still, image contrast, in particular contrast bet­ween gray and white matter is obviously not the same because in the infant mye­li­na­tion has not reached the adult stage and both T1 and T2 of white matter are higher than T1 and T2 of gray matter.


Therefore, it is necessary to adjust the timing parameters of all pulse sequences accordingly. When using IR sequences at mid-field in the neonatal period, a TR of 3000 ms and TI of 1000 ms are required to produce images with useful soft tissue contrast. The TR and TI can be halved by the time the child is two years of age. When using SE sequences, TR has to be prolonged accordingly for T2- weigh­ted images. The use of the same pulse parameters in infants as in adults will lead to images without diagnostic value (Figure 09-13). In children aged three to six years, the sequence parameters of adults can be used.
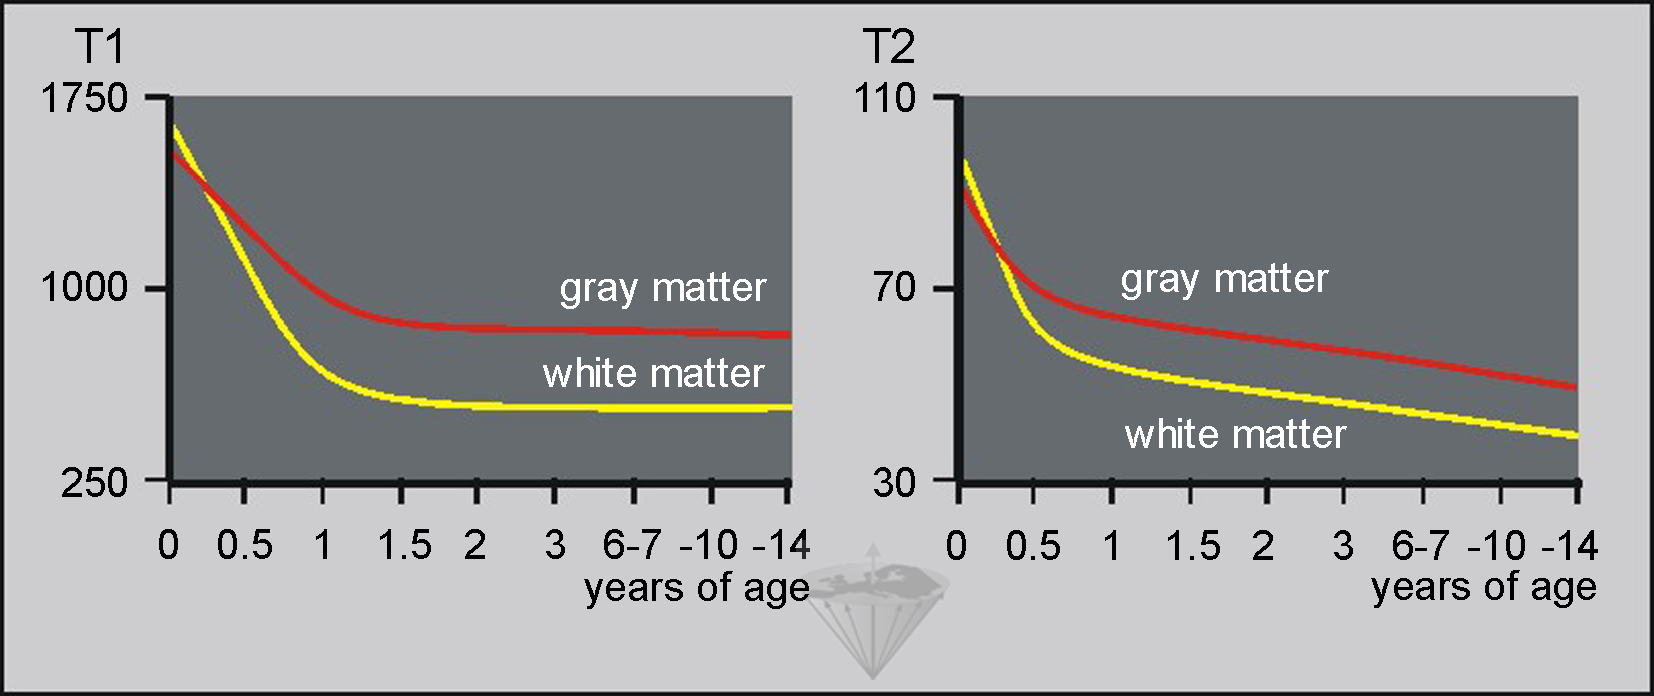

Figure 09-13:

T1 relaxation times (left) and T2 relaxation times (right) of gray and white matter by age in milli­seconds. Note that from birth until approximately six months of age, both T1 and T2 of gray mat­ter are shorter than T1 and T2 of white matter. In vivo measurements at low field; standard de­vi­a­tion approximately 25%.
T1 and T1 in milliseconds (ms). Modified from ⇒ Holland.


09-08 Temperature

The influence of temperature on relaxation times is well known from analytical NMR (Figure 09-14). Temperature also influences the diffusion coefficient and the chemical shift of the water peak. Thus, the question arose if in MR imaging temperature changes in the human body may influence relaxation times of tis­sues and therefore contrast. This might occur, for instance in patients running high temperatures one day when undergoing MR and having normal tem­pe­ra­tu­res during a follow-up examination.

Relaxometric measurements proved that any differences created are within the system error and do not influence contrast in MR imaging of patients [⇒ Rinck].


Figure 09-14:
Drastic change of temperature. The white curve shows the decrease of signal in­ten­si­ty of a T1-weighted pulse sequence be­fore, during and after local heating (red curve) of brain tissue in an ex vivo ex­pe­ri­ment. The temperature changes from 25° C to more than 60° C; relative SI drops by 50%. – SI = relative signal intensity; tem­pe­ra­tu­re in °Celsius.


Thermometry. The commonly used method of magnetic resonance ther­mo­me­try is not based upon relaxation times measurements, but on changes of the re­so­nan­ce frequency caused by temperature changes.

In water, the electrons shield the nucleus from the magnetic field and thus de­crease the hydrogen resonance frequency. However, as the temperature in­crea­ses, hydrogen bonds reorganize and the electron shield of the protons from the magnetic field gets even stronger, reducing the net field the protons are exposed to. Their resonance frequency increases and this change can be measured and re­la­ted to temperature. This process is described as as proton resonance frequency shift (PRF or PRFS) thermometry. It is calculated from a series of gradient echo images [⇒ Rieke].

MR thermometry is applied to monitor major local changes in temperature, for instance in laser therapy of malignancies. Temperature-related effects can be mapped dynamically [⇒ Hynynen; ⇒ Le Bihan; ⇒ Matsumoto]. Quantitative MR ther­mo­me­try is within clinical reach and may have a significant impact in in­ter­ven­ti­onal radiology [review articles: ⇒ Peters; ⇒ Quesson].

spaceholder 600 spaceholder 600

LogoTop
LogoBottom
space
00-f1
space
00-f2
space
00-f3
space
00-f4
space
00-f7
space
00-f1
space
00-f2
space
00-f3
space
00-f4
space
00-f7