


 mong the main contrast parameters are the relaxation times T1 and T2. If they change, contrast also changes.
T1 is strongly field-dependent. Therefore, at given pulse sequence parameters, contrast changes with field strength. The way these changes occur is nearly impossible to predict because it is extremely difficult to extrapolate the T1 values of a particular tissue acquired at one field strength to another: T1 is determined by several factors which vary at different fields. Within today's routine imaging range (low to ultrahigh fields up to 3 Tesla), T2 is more or less constant; however, when moving into ultrahigh fields (> 2 T), T2 starts showing some shortening, even more so T2*.
The best method to examine these features is relaxometry, the study of the behavior of longitudinal and transversal nuclear relaxation and of their dependence on internal and external parameters. Among these parameters are molecular and supramolecular structures, temperature, viscosity, pH, magnetic field strength, and paramagnetic and ferromagnetic agents. Field-cycling relaxometry deals with the relaxation behavior and its changes with the strength of the magnetic field. It requires special, purpose-built machines, field cycling relaxometers.
 Figure 10-15 (top) depicts the T1 relaxation times (T1 dispersions) of white and gray matter of an adult brain versus field strength. They both increase with field, but with a different ratio to each other. When comparing the contrast behavior of different tissues within the imaging range of MR fields, one finds that pure T1-contrast increases from low fields and reaches a peak in medium fields between 0.4 and 0.9 Tesla; then it decreases again in high and ultrahigh fields (Figure 10-15 bottom) [⇒ Fischer 1989, ⇒ Rinck 1988].
Reduced contrast between gray and white matter has been described in clinical settings comparing 1.5 T and 3.0 T on T1-weighted images; no change was observed on T2-weighted images [⇒ Schick 2005]. However, in most cases, clinical images (T1-, T2- or intermediately weighted) possess sufficient contrast even at high and ultrahigh fields if parameters and pulse sequences are chosen properly and not only one of the major contrast factors influences contrast [⇒ Chen 1986, Fischer 1990, Hoult 1986].
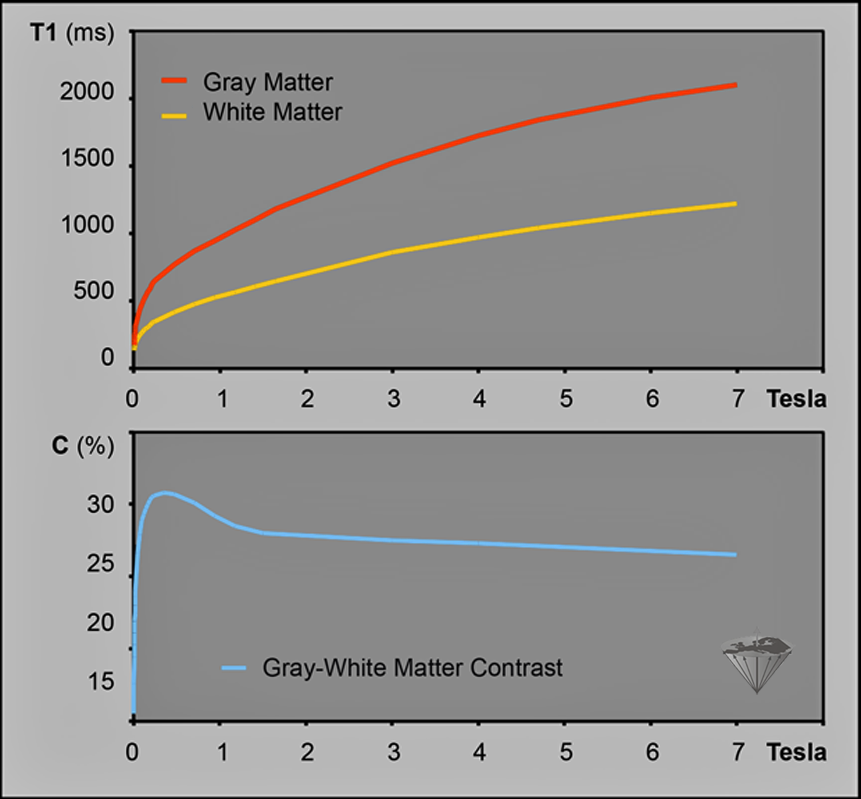
Figure 10-15:
(Top): T1 relaxation time values of gray and white matter versus field strength. The measurements up to 1.5 Tesla were performed on a NMRD relaxometer with fresh human brain samples. The advantages of relaxometric measurements of ex vivo samples are the extreme high accuray of the measurements, the selection of tissue that looks homogeneous with the ability to reject mixed tissue samples, and the detailed histology available after the measurements.
The values relating to fields higher than 1.5 T were acquired in vivo on spectrometers with the traditional SE/IR sequences for the calculation of T1 time constants or on whole-body MR machines with modified Look-Locker sequences to estimate T1; they were fitted. Details of these techniques are given in Chapter 4. Cross relaxation phenomena can lead to quadrupolar dips in the T1-dispersion plot. They are dependent on field strength and temperature (see Figure 04-22).
(Bottom): Approximation of pure-T1 contrast between gray and white matter: Contrast is relatively poor at very low fields. It climbs to a small peak in low/medium fields. Then it decreases slowly at higher fields.
T1 dispersion curves of different tissues do not necessarily run parallel to each other, but can cross each other.
For heavily T1-weighted images of any pulse sequence, this feature becomes important because diseases cannot be detected at certain fields with T1-weighted sequences. MS plaques, for instance, have a similar signal intensity as their surrounding tissue at medium and high fields when imaged with a heavily T1-weighted pulse sequences. Contrast exists only at ultra-low fields and diagnostic pulse sequence parameters have to be adjusted towards T2-weighted sequences.
When comparing MR images acquired at different field strength, it is important to keep in mind that T1 grows with field strength. This increase is the reason why images taken with the same pulse parameters, but at different fields, change their contrast appearance. Thus, they cannot be directly compared with each other, as the comparison of Figure 10-16 shows.
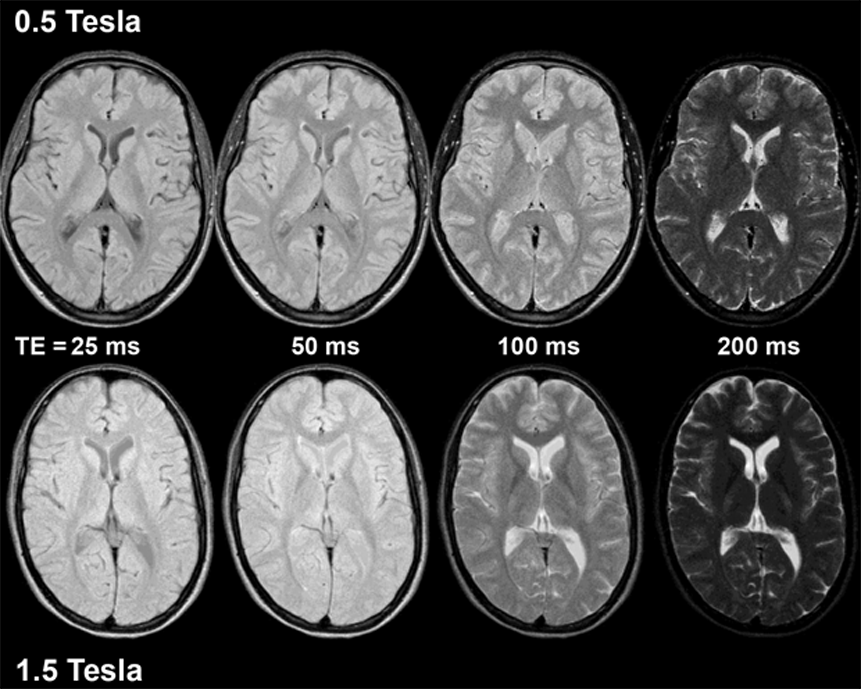
Figure 10-16:
Image series on top at 0.5 Tesla, on bottom at 1.5 Tesla; TR = 2000 ms. Contrast changes and differs between the two field strengths using the same imaging parameters.

Figure 10-16-Video:
Animation: The image series on the left side was taken at 0.5 Tesla, the one to the right at 1.5 Tesla at a repetition time TR = 2000 ms. Compare how contrast changes and differs between the two field strengths using the same imaging parameters.
Simulation software: MR Image Expert®
If, at higher field strength the pulse sequence parameters are adjusted accordingly, contrast losses can be balanced (Figure 10-17).
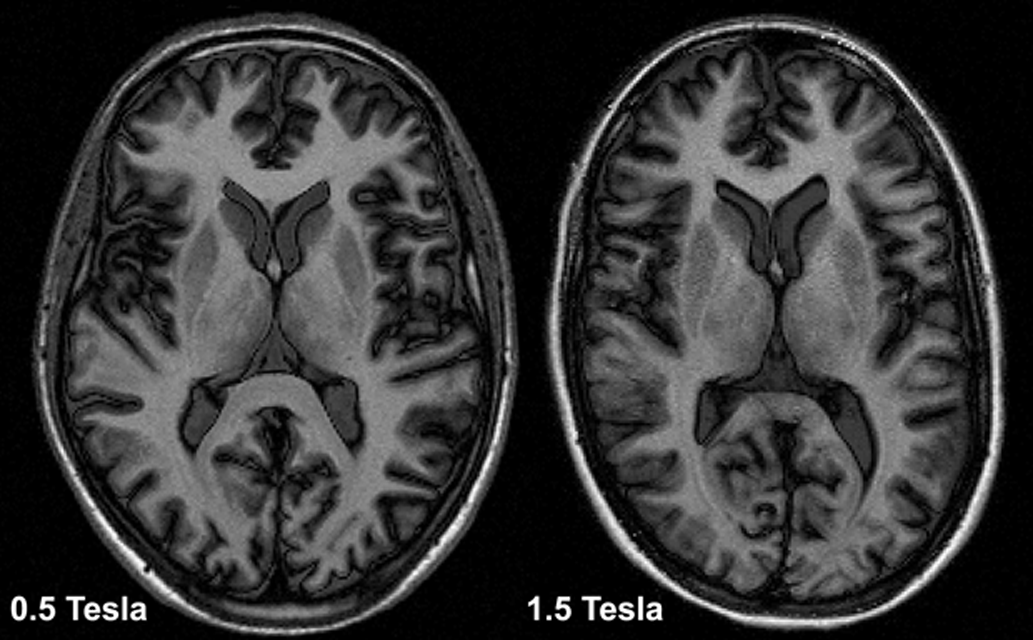
Figure 10-17:
Transversal images of the brains of two healthy volunteers created at 0.5 Tesla (left) and at 1.5 Tesla (right); regular inversion recovery pulse sequence; the parameters were adjusted to the different T1 values at 0.5 and 1.5 Tesla. The contrast resolution at 0.5 Tesla is slightly better than at 1.5 Tesla; however, at both field strengths anatomic details are very well seen.


|

|
|---|