


 he deconvolution of a FID is essential for the analysis of the information hidden in it. The idea of separating electromagnetic radiation into frequency components is familiar to us through the use of a prism to split white light into its constituent colors, each of which has a different frequency (Figure 02-14).
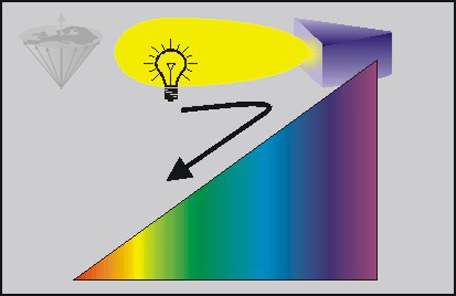
Figure 02-14:
Frequency analysis: visible light is broken down into its components by a prism. The constituent colors are those of the rainbow. They have different frequencies.
The components of a magnetic resonance signal can be analyzed by subjecting the signal to a Fourier transform. In this case, the prism is replaced by a computer.
The physical phenomenon of a FID can be compared to the sound received from a bell. This sound is initialized by a short-lived impulse produced by the action of the clapper. The resonating sound resulting from it is of high intensity at the beginning, but decays in intensity as a function of time.
The signals emanating from an inhomogeneous magnetic field can be compared to several bells tolling at the same time, creating a sound pattern which does not easily allow the differentiation of a single bell. Before it is possible to separate the received oscillating signal into its components, it must be digitized, converted into a binary sequence, and stored in a computer.
Applying a Fourier Transform (FT), one then can analyze the signal for its frequency components and determine the intensity of each frequency. With a Fast Fourier Transform (FFT) algorithm, this may take only a few milliseconds. It is possible to analyze the frequencies of a number of bells tolling at the same time by measuring their combined response at a particular frequency and then proceeding to the next frequency until the whole frequency range has been covered. This is analogous to the original magnetic resonance experiment.
However, if we excite and then measure all frequencies at the same time in the same experiment, we obviously greatly increase the efficiency of the experiment. In pulsed magnetic resonance, all frequencies of interest are excited by the pulse, and we rely on the Fourier transformation to sort out the intensity of response at each frequency (Figure 02-15).
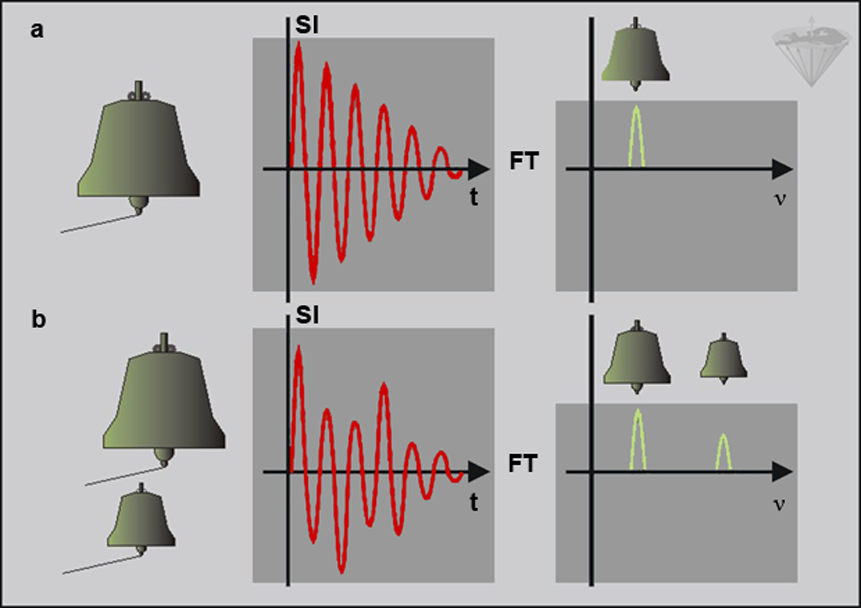
Figure 02-15:
The equivalent example: the sound wave originated by a single bell and by two bells of different sizes. Tolling a single bell once gives a clean sound (not in reality, but for the sake of our example), while tolling several bells at the same time gives a mixed sound.
The Fourier transform (FT) of the signal emitted by a single bell (or a pure water sample in NMR) and two different bells (water containing different components in NMR) provide us with spectra showing the frequency content of the sound. The same mathematical analysis can be used for the FID.
(SI = signal intensity; t = time; ν = frequency).


|
Chapter 2 — Page 9 |

|
|---|