


![]() n most MR imaging sequences applied in clinical routine today, raw data are placed in a rectangular k-space grid [⇒ Edelstein 1980].
n most MR imaging sequences applied in clinical routine today, raw data are placed in a rectangular k-space grid [⇒ Edelstein 1980].
For example: In a standard spin-echo sequence, each 90° pulse creates a new line (Figure 07-08). The length of the line is determined by the strength of the frequency-encoding gradient and the sampling time, its position by the strength of the phase-encoding gradient.
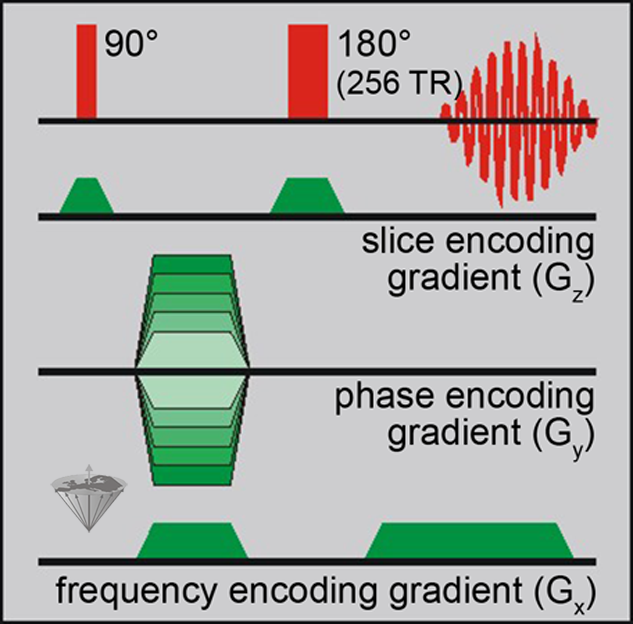
Figure 07-08:
Graphic depiction of a spin-echo pulse sequence.
The position of the line is determined as follows: After the initial 90° excitation pulse, the spins evolve in the direction given by the phase-encoding gradient Gy and the frequency-encoding gradient Gx (yellow arrow in Figure 07-09a). They are then turned around by the 180° pulse (red/magenta arrow). Then the frequency encoding gradient is switched on again and sampling starts. This is repeated for different amplitudes of the phase-encoding gradient until k-space is filled (Figure 07-09b).
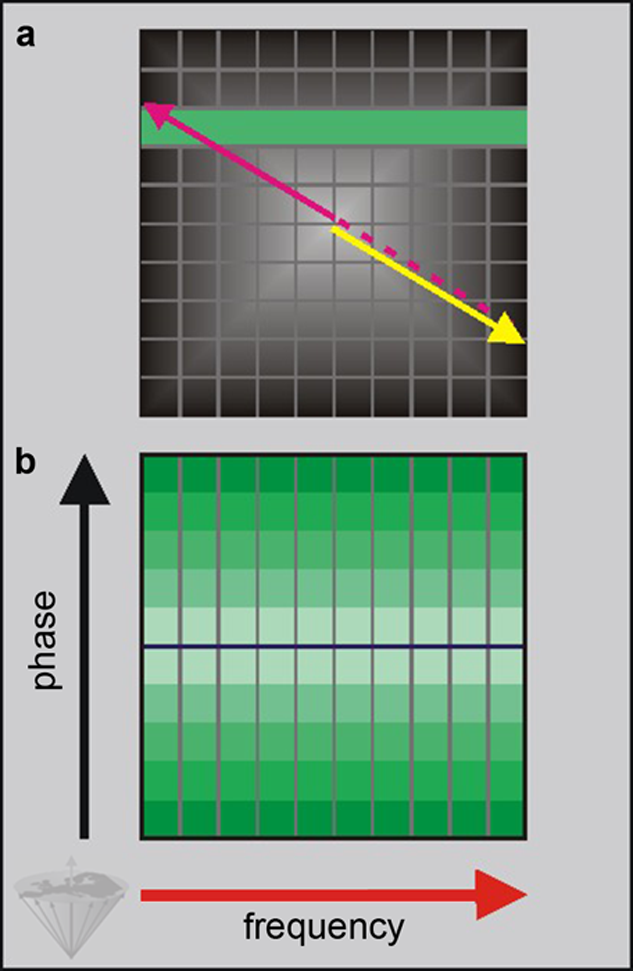
Figure 07-09:
Mapping of k-space in a spin-echo pulse sequence.
(a) Positioning of a single line.
(b) Filling of the entire k-space. Phase direction: blue arrow, frequency direction: red arrow.
In conventional pulse sequences, such as the spin-echo sequence, one line of k- space is filled per repetition time (TR) cycle (commonly there are 256 cycles per imaging experiment, not only ten as in this figure).
The time needed for such an imaging experiment is the number of phase-encoding steps (NGy) multiplied by the repetition time (TR) and the number of excitations (NEX):
Now we have filled the data matrix with each row containing information from one echo. Each data point is then Fourier-transformed in the x-direction, which leads to a new data matrix where every point in each column contains information stemming from a certain frequency; the phase information differs point-by-point per row.
The second Fourier transform is performed in the y-direction to extract phase information.
This again leads to a new data matrix containing combined phase and frequency information. The output is a matrix showing a modulus or magnitude image which corresponds to the bulk of MR signals from each point. Phase correction might be necessary to correct for phase jumps between 0° and 360°.
Among the main parameters influenced by k-space are the speed of acquisition, spatial resolution, field-of-view, contrast, and artifacts. Details can be found in some dedicated papers [⇒ Hennig 1999, ⇒ Mezrich 1995, ⇒ Pelc 1993, ⇒ Peters 1993].


|

|
|---|