


 agnetic resonance elasticity imaging (MR elastography, MRE) is a conversion of palpation of tissues and organs by a physician into a two- or three-dimensional color-coded depiction of tissue stiffness. It was first described in 1995 [⇒ Muthupillai 1995]. MR elastography has become a popular tool in the diagnosis and staging of liver fibrosis. Publications have reported MRE techniques and results using many different parameters, acquisition techniques, processing methods, and varied nomenclature. The diversity of terminology can lead to confusion [⇒ Manduca 2021].
The technique is non-invasive and permits the evaluation of the shear elasticity of tissues by using a mechanical excitation with a vibration source and special MR pulse sequences with synchronized motion encoding (Figure 11-16). Stiffer tissues possess longer wave lengths, softer shorter ones. The wave images are processed to create scaled, quantitative images representing the relative stiffness (elastograms), commonly depicting shear stiffness on a scale from 0 to 8 kPa. The spatial resolution is one-third to one-fifth of the MRI resolution (Figure 11-17).
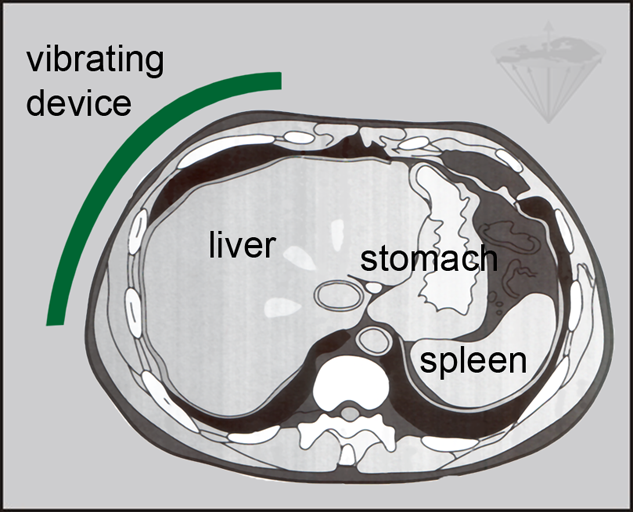
Figure 11-16:
A vibration source (green) is attached to the body of a patient to mechanically generate waves through the organ of interest, in this case the liver. Then, a 2D or 3D gradient echo-based MR elastography sequence is applied.
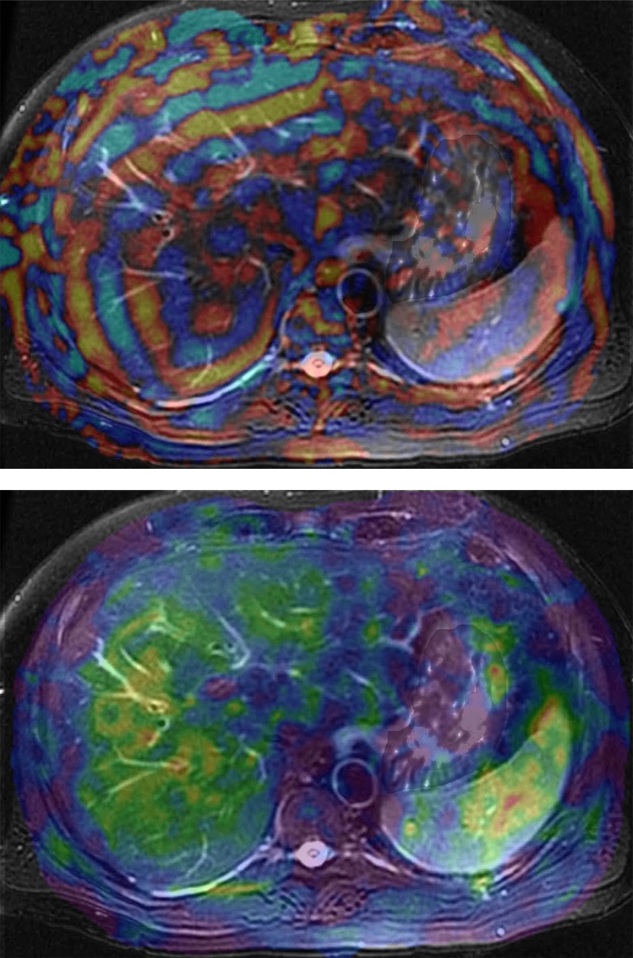
Figure 11-17:
Top: Wave image. Bottom: Processed elastogram.
Both are overlay images (cf. Chapter 15); they are superimposed on the respective high-resolution MR image in the liver/stomach/spleen level.
At present, the main focus of MRE are hepatic diseases such as fibrosis and cirrhosis. The stiffness of the diseased liver tissue is significantly higher than that of normal tissue [⇒ Venkatesh 2013]. Nearly everybody in MRE research is aiming for the liver; applications beyond the liver include possible indications in the brain, breast, and the musculoskeletal system.
 Critical remarks. MR elastography images are colorful and nice to look at. However, there are no comparison and outcome studies. In many instances elastograms seem not to add any information of use to the clinical case.
Ascites, iron deposition, and obesity can cause failure of MRE studies. The technical failure rate increases substantially at ultrahigh fields [⇒ Wagner 2017].


|

|
|---|